Abt Associates Inc. / Woods Hole Group
Preliminary TDA
Gulf of Honduras
A Programme of the Governments of the Gulf of Honduras Countries, with the assistance
of the Inter-American Development Bank
Gulf of Honduras
Preliminary Transboundary
Diagnostic Analysis
Final Draft
August, 2003
Global Environment Facility--Inter-American Development Bank
Project Development Facility (PDF-B)
i
Abt Associates Inc. / Woods Hole Group
Preliminary TDA
Table of Contents
1.0 INTRODUCTION........................................................................................................................ 1
1.1 TDA CONTENT AND PROCESS ................................................................................................. 1
1.2 SCOPE OF THE TDA ................................................................................................................. 1
2.0 PHYSICAL AND BIOGEOCHEMICAL SETTING............................................................... 4
2.1 WATERSHED ............................................................................................................................ 4
2.1.1 Drainage Basins............................................................................................................... 5
2.1.2 River Discharge ............................................................................................................... 6
2.1.3 Sediment Discharge from Rivers ..................................................................................... 7
2.1.4 Shoreline Classification ................................................................................................. 15
2.1.5 Climate........................................................................................................................... 15
2.2 GEOLOGY AND GEOMORPHOLOGY......................................................................................... 20
2.2.1 Geology .......................................................................................................................... 20
2.2.2 Coastal Processes and Coastal Erosion ........................................................................ 21
2.3 OCEANOGRAPHY.................................................................................................................... 21
2.3.1 Seawater Properties in the Gulf of Honduras................................................................ 25
2.3.2 Ocean and Coastal Currents ......................................................................................... 31
2.4 ECOSYSTEMS VULNERABLE TO WATER QUALITY DEGRADATION IN THE GULF OF
HONDURAS...................................................................................................................................... 33
2.4.1 Mangroves/Coastal Forests........................................................................................... 33
2.4.2 Seagrass Meadows......................................................................................................... 34
2.4.3 Coral Reefs..................................................................................................................... 34
2.5 BIODIVERSITY AND PROTECTION STATUS IN THE GULF OF HONDURAS AND ITS
WATERSHED .................................................................................................................................... 35
2.5.1 Marine Biodiversity........................................................................................................ 35
2.5.2 Endangered Species ....................................................................................................... 36
2.5.3 Protected Areas.............................................................................................................. 38
3.0 SOCIO-ECONOMIC AND DEVELOPMENT SETTING.................................................... 42
3.1 POPULATION AND DEMOGRAPHIC PATTERNS IN THE GULF OF HONDURAS WATERSHED ....... 42
3.1.1 Current Population and Population Growth Rates ....................................................... 43
3.1.2 Literacy Rates ................................................................................................................ 44
3.1.3 Access to Healthcare...................................................................................................... 44
3.2 REGIONAL ECONOMIC CHARACTERISTICS ............................................................................. 45
3.2.1 Structure of Economic Output in the Watershed ........................................................... 45
3.2.2 Future Trends in Economic Output in the Watershed for the Next 10 Years ................ 46
3.3 INDUSTRIES IMPACTING AND IMPACTED BY THE GULF OF HONDURAS .................................. 47
3.3.1 Agriculture ..................................................................................................................... 47
3.3.2 Commercial and Artisanal Fisheries ............................................................................. 47
3.3.3 Aquaculture.................................................................................................................... 48
3.3.4 Tourism .......................................................................................................................... 49
3.3.5 Marine Transport ........................................................................................................... 50
June 2, 2003
i
Abt Associates Inc. / Woods Hole Group
Preliminary TDA
3.3.6 Industry .......................................................................................................................... 51
4.0 OVERVIEW OF APPLICABLE INSTITUTIONAL AND REGULATORY
FRAMEWORKS .............................................................................................................................. 53
4.2 MARITIME ADMINISTRATION................................................................................................. 55
4.2.1 Belize .............................................................................................................................. 55
4.2.2 Guatemala...................................................................................................................... 57
4.2.3 Honduras........................................................................................................................ 59
4.3 OTHER PROJECT-RELATED PROGRAM AREAS........................................................................ 61
5.0 MAJOR PERCEIVED PROBLEMS AND ISSUES ............................................................. 67
5.1 NEGATIVE ENVIRONMENTAL EFFECTS ARISING FROM EXISTING AND FUTURE PORT
OPERATIONS AND INFRASTRUCTURE DEVELOPMENT: ..................................................................... 70
5.1.1. Port Expansion and Maintenance Activities.................................................................. 75
5.1.2 Loading/Offloading and Storage of Cargo .................................................................... 78
5.1.3 Waste Generation and Handling ................................................................................... 79
5.1.4 Ballast Water.................................................................................................................. 80
5.1.5. Port-Related Industry..................................................................................................... 81
5.2 NEGATIVE ENVIRONMENTAL EFFECTS ARISING FROM MARINE ACTIVITIES.......................... 83
5.2.1 Degradation Resulting from Oil and Chemical Discharge ........................................... 83
5.2.2 Degradation Resulting from Other Marine Activities ................................................... 92
5.2.3 Sensitive Area Mapping ................................................................................................. 92
5.3 OTHER LAND-BASED ACTIVITIES (OTHER THAN SHIPPING-RELATED) CAUSING
DEGRADATION OF THE ECOSYSTEMS OF THE GULF OF HONDURAS................................................... 96
5.3.2 Logging .......................................................................................................................... 98
5.3.3 Municipal Sewage Discharge ...................................................................................... 100
5.3.4 Aquaculture.................................................................................................................. 100
5.3.5 Tourism ........................................................................................................................ 101
5.3.6 Industrial Discharge .................................................................................................... 102
5.4 PRELIMINARY ASSESSMENT OF THE RELATIVE IMPORTANCE AND LOCAL AND
TRANSBOUNDARY IMPACT OF LAND-BASED VS. SHIP-BASED SOURCES OF POLLUTION ............... 110
6.0 STAKEHOLDER ANALYS IS .............................................................................................. 115
6.1 LINKS WITH OTHER INTERNATIONAL AND REGIONALLY SIGNIFICANT PROJECTS AND
INSTITUTIONS ................................................................................................................................ 115
6.2 STAKEHOLDER CONSULTATIONS ......................................................................................... 118
6.2.1 Public Sector National and Local Government ........................................................ 119
6.2.2 Civil Society ................................................................................................................. 122
6.2.3 Private Sector............................................................................................................... 123
7.0 ENVIRONMENTAL QUALITY OBJECTIVES ................................................................ 125
8.0 BIBLIOGRAPHY................................................................................................................... 127
June 2, 2003
ii
Abt Associates Inc. / Woods Hole Group
Preliminary TDA
APPENDICES
APPENDIX A
List of Abbreviations
APPENDIX B
Causal Chain Analysis
APPENDIX C
Supplementary Data
APPENDIX D
Supplementary Figures (Maps)
(separate file)
List of Figures
Figure 2.0-1. Gulf of Honduras Project Area............................................................................................................................. 4
Figure 2.0-2. Gulf of Honduras Watershed................................................................................................................................ 4
Figure 2.1-1. Rivers in the Gulf of Honduras Watershed........................................................................................................ 6
Figure 2.1-2. Monthly Average Discharge for the Rio Grande River, Honduras................................................................ 7
Figure 2.1-3. Land Use Coverage Gulf of Honduras ............................................................................................................ 10
Figure 2.1-4. Digital Elevation Map- Gulf of Honduras ..................................................................................................... 11
Figure 2.1-5. Slope Map- Gulf of Honduras Watershed........................................................................................................ 12
Figure 2.1-6. Average Rainfall- Gulf of Honduras Watershed............................................................................................. 13
Figure 2.1-7. Erosión Potential Index- Gu lf of Honduras Watershed................................................................................ 14
Figure 2.1-8. Mean Monthly Temperatures for the Gulf of Honduras Marine Area ........................................................ 16
Figure 2.1-9. Regional Precipitation Patterns in the Gulf of Honduras .............................................................................. 17
Figure 2.1-10. Mean Monthly Precipitation in the Gulf of Honduras ................................................................................. 18
Figure 2.1-11. Seasonal Evolution of Sea Surface Temperatures (Pathfinder AVHRR) and Surface Winds
(NCEP/NCAR Reanalysis Project) for the Caribbean Sea. ......................................................................................... 19
Figure 2.1-12. Map of Hurricane Tracks in the Gulf of Honduras, 1921-1999................................................................. 20
Figure 2.3-1. The Caribbean Basin: Bathymetry and Circulation........................................................................................ 24
Figure 2.3-2. Surface (left) and Bottom (right) Water Temperature Variations at Cayos Cochinos in 1993 1996. 25
Figure 2.3-3. Surface Salinity Distribution in the Snake Cays (Western Gulf) ................................................................. 27
Figure 2.3-4. Schematic Representation of Salinity Distribution and Flows in a Typical Estuarine System............... 28
Figure 2.3-5. AQUA MODIS (Moderate Resolution Imaging Spectroradiometer) image of the Gulf of Honduras
Area (MODIS Band Combination: 1, 4, 3) Showing a Pattern of Low Turbidity Water Formed on the Inner
Side of the Barrier Reef...................................................................................................................................................... 29
Figure 2.3-6. Seawater Transparency Distribution Close to Deep River Mouth in February 1999............................... 30
Figure 2.3-7. Oceanographic Currents in the Gulf of Honduras .......................................................................................... 32
Figure 2.5-1. Manatee Habitats and Turtle Nesting Areas in the Port Honduras Area .................................................... 37
Figure 2.5-2. Protected Areas in the Gulf of Honduras ......................................................................................................... 40
Figure 3.1-1. Population in the Gulf of Honduras Watershed by Administrative District............................................... 43
Figure 3.1-2. Population Density in the Coastal Zone of the Gulf of Honduras Watershed........................................... 43
Table 4.1-1. Figure Relevant International Conventions Related to Maritime Administration...................................... 54
Figure 4.2-2. Maritime Organization in Guatemala ................................................................................................................ 59
Figure 4.2-3. Organization of the National Port Authority in Honduras (next page)....................................................... 59
Figure 4.3-1. Belize Government Structure for Environmental Protection........................................................................ 62
Figure 4.3-2. Guatemala Government Structure for Environmental Protection................................................................ 64
Figure 4.3-3. Honduras Government Structure for Environmental Protection.................................................................. 66
Figure 5.1-1. Ecosystems of the Gulf of Honduras and its Watershed................................................................................ 68
Figure 5.1-1. Belize City Port ..................................................................................................................................................... 70
Figure 5.1-2. Port of Big Creek.................................................................................................................................................. 71
June 2, 2003
iii
Abt Associates Inc. / Woods Hole Group
Preliminary TDA
Figure 5.1-3. Puerto Santo Tomás de Castilla ......................................................................................................................... 72
Figure 5.1-4. Puerto Barrios........................................................................................................................................................ 73
Figure 5.1-5. Puerto Cortés ......................................................................................................................................................... 74
Figure 5.2-1. Sensitive Areas in the Gulf of Honduras Particularly Vulnerable to Contamination from Oil and
Chemical Spills .................................................................................................................................................................... 93
Figure 5.2-2. Sensitive Vulnerable Areas Adjacent to the Port of Big Creek.................................................................... 94
Figure 5.2-3. Sensitive Vulnerable Areas Adjacent to Puerto Santo Tomás de Castilla and Puerto Barrios ............... 94
Figure 5.2-4. Sensitive Vulnerable Areas Adjacent to Puerto Cortés.................................................................................. 95
Figure 5.3-1 Land Use in the Gulf of Honduras...................................................................................................................... 96
Figure 5.3-2. Potential BOD Loads- Gulf of Honduras Watershed...................................................................................107
Figure 5.3-3. Potential Nitrogen Loads- Gulf of Honduras Watershed.............................................................................108
Figure 5.3-4. Potential Phosphorus Loads- Gulf of Honduras Watershed........................................................................109
List of Tables
Table 2.1-1. Major Watersheds of the Gulf of Honduras ........................................................................................................ 5
Table 2.1-2. Subsidiary Watersheds of Belize ........................................................................................................................... 5
Table 2.1-3. Major Rivers Entering the Gulf of Honduras...................................................................................................... 6
Table 2.1-4. Preliminary Estimation of the sediment Loasd of the main tributaries of the Gulf of Honduras............... 9
Table 2.4-1. Mangrove Coverage and Protection in the Gulf of Honduras Waters hed in Guatemala, 1999................ 34
Table 2.5-1. Summary of Biological Diversity in Caribbean Coastal and Marine Areas in Belize, 1998 .................... 36
Table 2.5-2. Invertebrates and Urochordates in the Honduran Coastal Waters of the Caribbean.................................. 36
Table 2.5-3. Status of Coastal and Marine Species of Primary Interest in Belize, 1998.................................................. 38
Table 2.5-4. Status of Coastal & Marine Species of Primary Interest in Guatemala ........................................................ 38
Table 2.5-5. Protected Areas in the Gulf of Honduras Region ............................................................................................. 40
Table 2.5-6. Areas for Existing Marine Protected Areas in Belize ...................................................................................... 41
Table 3.1-1. Human Development Indicators.......................................................................................................................... 42
Table 3.1-2. National Population and Population Growth Rates in the Gulf of Honduras Countries............................ 43
Table 3.1-3. Population Density in the Southern Region of Belize by District, 1970-1998............................................ 43
Table 3.1-5. Literacy rates and education spending in the Gulf of Honduras countries .................................................. 44
Table 3.1-5. Healthcare Statistics in the Gulf of Honduras Countries ................................................................................ 45
Table 3.3-1. Status of Active Shrimp Farms in the Southern Region of Belize, 1999..................................................... 49
Table 3.3-2. Cargo Imported/Exported Through Ports Annually (Metric Tons)............................................................... 51
Table 3.3-3. Port Ship Calls in the Gulf of Honduras ............................................................................................................ 51
Figure 4.2-1. Maritime Administration for Belize (next page)............................................................................................. 55
Table 5.1-1. Port Equipment....................................................................................................................................................... 75
Table 5.2-1. Hydrographic Component Gap Analysis Summary Findings..................................................................... 85
Table 5.2-2. Hydrographic Component Gap Analysis -- Belize ........................................................................................... 86
Table 5.2-3. Hydrographic Component Gap Analysis -- Guatemala ................................................................................... 87
Table 5.2-4. Hydrographic Component Gap Analysis -- Honduras..................................................................................... 88
Table 5.2-5. Hydrographic Surveys and Data Availability in the Region .......................................................................... 89
Table 5.3-1. Estimate of Nitrate and Phosphate Loads into Surface Waters by Banana and Citrus Production in the
District of Stann Creek, Belize1994................................................................................................................................. 97
Table 5.3-2. Agricultural Wastes and Inputs to the Environment........................................................................................ 98
Table 5.3-3. Logging Activity .................................................................................................................................................... 99
Table 5.3-4. Sanitation Coverage by District in Southern Belize, 1994 ...........................................................................100
Table 5.3-5. Parameters Monitored by the Shrimp Mariculture Industry in Southern Belize, 1998............................101
Table 5.3-6. Major Industries (Excluding Those Associated with Ports).........................................................................103
Table 5.3-7. BOD, Nitrogen and Phosphorus Potential Loads to the Gulf of Honduras................................................105
Table 5.4-1. Ranking Scheme for Relative Assessment of Impacts ..................................................................................111
Table 5.4-2. Relative Ranking of Environmental Importance of Various Land-Based and Ship-Based Activities ..113
June 2, 2003
iv
Abt Associates Inc. / Woods Hole Group
Preliminary TDA
1.0 Introduction
1.1
TDA Content and Process
According to GEF guidance, the purpose of conducting a Transboundary Diagnostic Analysis (TDA) is to
scale the relative importance of sources and causes, both immediate and root, of transboundary `waters'
problems, and to identify potential preventive and remedial actions. The TDA provides the basis for
development of both the National Action Plans (NAPs) and the Strategic Action Programme (SAP) in the
area of international waters of the GEF.
This TDA, therefore, summarizes information available from the region, gathered both as part of ongoing
national activities within the littoral states, as well as information made available from a variety of
internationally supported activities in the region.
The methodology for a TDA consists of the following steps, at a minimum:
·
Identification of major perceived problems and issues, including status and gaps
·
Classification as national or transboundary in nature
·
Causal chain analysis (including root causes)
Because the list of possible interventions and actions arising from the analysis of the Gulf of Honduras
problems is so large, a mechanism was needed in order to prioritize the interventions. Borrowing from
methodology commonly used in the European Union and other regions, the present preliminary TDA
identifies a series of draft Environmental Quality Objectives (EQOs), which represent the regional
perspective of major goals for the regional environment. The use of EQOs helps to refine the TDA
process by achieving consensus on the desired status of the Gulf of Honduras. Within each EQO (which
is a broad policy-oriented statement), several draft specific targets were identified. Each target generally
had a timeline associated with it, as well as a specific level of improvement or target status. Thus, the
targets illustrate the chain of logic for eventual achievement of the EQO. Specific interventions or actions
were identified in the Project Brief to permit realization of each of the targets within the designated time
frame.
A prime purpose of the TDA is to determine priority Transboundary problems. EQOs and the entire TDA
process may also specify more national problems or issues. Although these national issues are included
in the TDA, they are identified as not having strong transboundary implications, and therefore will be of
lesser concern to the GEF process.
In summary, this TDA follows the GEF TDA Guidelines for International Waters projects. An additional
step was achieved, however, that is, the use of EQOs to facilitate consensus on the desired state of the
Gulf of Honduras after the next pentade or decade. The EQOs naturally led to the identification of
specific targets to be met within the desired time frame, which then led to the identification of specific
interventions and actions that can be considered in the framework of the SAP. GEF interest will focus on
those priority transboundary problems and issues.
1.2
Scope of the TDA
This TDA is being developed in support of the project for the environmental management of the Gulf of
Honduras, "Environmental Protection and Maritime Transport Pollution Control in the Gulf of
June 2, 2003
1
Abt Associates Inc. / Woods Hole Group
Preliminary TDA
Honduras," which has a primary focus on some of the major environmental problems and issues of the
Gulf leading to the degradation of marine and coastal ecosystems by human activities. The present
analysis covers the three countries that are located in the Gulf of Honduras: Belize, Guatemala and
Honduras. The analysis focuses on prioritizing environmental stressors on the Gulf's coastal and marine
ecosystems that are derived from pollution related to the maritime shipping industry in the region and
land-based sources of pollution in the watershed.
This study is meant to complement the Threat and Root Cause Analysis developed by the World
Bank/GEF/CCAD Project for the Conservation and Sustainable Use of the Mesoamerican Barrier Reef
System (MBRS) which identified the tri-national area of the Gulf of Honduras as a critical area. In
particular, port and ship-based pollution were recognized as significant threats to the health of the reef
ecosystem and are consequently to be addressed by this complementary project. This project also
complements the on-going UNDP/GEF Project for the Conservation and Sustainable Use of the Barrier
Reef Complex in Belize.
Many institutions and experts from the Gulf of Honduras region participated in the development of this
preliminary TDA. After the initial determination of stakeholders and interested parties was made, a
public consultation process was developed to inform and incorporate the input from representative
members of each of the target groups in the study area. Public consultations were conducted through a
combination of regional workshops held in each of the three countries and individual meetings. One
international stakeholders meeting was held on November 21, 2002 in San Pedro Sula, Honduras. A
second meeting was held on March 20-21, 2003 in Guatemala City, Guatemala and a third stakeholder
meeting is to be held on June 12-13, 2003 in Belize City, Belize.
The regional stakeholder advisory committee has had an important role in reviewing and providing
comments on the development of this preliminary TDA. The stakeholder committee consists of
approximately twenty-five members from representative national line agencies and municipal
governments, merchant marines and naval authorities, port authorities, nongovernmental organizations,
and industry from Guatemala, Honduras and Belize. Participation has been balanced to maintain a
representative group of stakeholders from the three countries. The stakeholder committee has provided
background data for this analysis, reviewed drafts of this document and provided information concerning
perceptions of problems and challenges facing regulatory agencies, the regulated community and civil
society organizations in the region.
While much data were obtained through this process, only partial information on the environmental status
was provided by each country, so this TDA is a summary of available information only. Where possible,
additional sources of data were sought.
The major sources of information are listed in the bibliography accompanying this TDA. Gaps in
information available for this Preliminary TDA can be filled during the full GEF project when the TDA
will be updated and completed.
Based on the early project development activities, as well as the regional consensusbuilding process, this
Preliminary TDA identifies a single major perceived problem and issue for the Gulf of Honduras:
Degradation of Coastal and Marine Ecosystems
The following causes of the MPPI have been determined and are examined in detail in the following
sections:
June 2, 2003
2
Abt Associates Inc. / Woods Hole Group
Preliminary TDA
·
Negative environmental effects arising from existing and future port operations and infrastructure
development
·
Negative environmental effects arising from marine activities
·
Other Land-Based Activities (other than shipping-related) causing degradation of the ecosystems of
the Gulf of Honduras
Below, each of these problems and issues is addressed from a status perspective. It answers the
questions: What do we know about this problem/issue? What data support the quantification of the
extent of the problem/issue? Do the data support these as real problems and issues, or just as perceptions?
This analysis took place on a scientific level, including biological, hydrological, physical, social, and
other perspectives on the problem. This is in effect the "status" assessment.
The next step was to perform the causal chain analysis; the major perceived problems and issues were
analyzed to determine the primary, secondary, and root causes for these problems/issues. Identification of
root causes is important because root causes tend to be more systemic and fundamental contributors to
environmental degradation. Interventions and actions directed at the root causes tend to be more
sustainable and effective than interventions directed at primary or secondary causes. Because the
linkages between root causes and solutions of the perceived problems are often not clear to policymakers,
however, interventions commonly are mistakenly directed at primary or secondary causes. This
Preliminary TDA attempts to clarify the linkages between root causes and the major perceived problem to
encourage interventions at this more sustainable level.
This Preliminary TDA faced several challenges in its preparation, including a lack of comple te
information and data, and a short time frame for its preparation.
June 2, 2003
3
Abt Associates Inc. / Woods Hole Group
Preliminary TDA
2.0 Physical and Biogeochemical Setting
The Gulf of Honduras, bounded by Belize, Guatemala, and Honduras, covers an area of approximately
10,000 square kilometers (Figure 2.0-1). The Project Area for the proposed GEF project extends from
Punta Sal, Punta Isopo, in the southeast, northwest towards Sittee Point along the Belize shoreline,
inwards along the northern border of the Maya Mountains watershed, southwestward along the various
watersheds of Belize (numerous watersheds, lumped here as the Maya Mountain watersheds), Guatemala
(Sarstoon, Laguna Izabal, Motagua), and Honduras (Ulua, Lean, Cuyamel, Chamelecon), reaching the
coast once again at Punta Isopo (Figure 2.0-2).
Figure 2.0-1. Gulf of Honduras Project Area
(See Appendix D)
Figure 2.0-2. Gulf of Honduras Watershed
(See Appendix D)
The Gulf of Honduras abuts the southwestern Caribbean Sea, having water depths of up to 2000 m. Its
western portion is lined by the MesoAmerican Barrier Reef Complex, stretching along the waters of
Belize into Guatemala. Inside the barrier reefs are shallow inner reef complexes, with many cays and
shoals. Along the Guatemala region, the Gulf of Honduras includes the Bahía de Amatique, and the
smaller bays of Graciosa and Santo Tomás de Castilla. Along the Honduras coast, the Gulf of Honduras
includes the Bahia de Cortés adjacent to Puerto Cortés.
The Gulf of Honduras is influenced strongly by both open ocean (Caribbean Sea) dynamics, as well as
reef-controlled dynamics, river inflow, sediment fluxes, and hurricane passage. Although located in a
region having reasonably stable annual climate, a seasonal wet-season, dry season combines with ocean
variability to impose scales of variability on the ecosystem. The complex interaction of open ocean
waters, coastal multiple time ocean processes, and riverine flows is reflected in geographically-varying
ecosystem components that contribute to the region's valuable ecological diversity.
Major coastal and marine ecosystem types along this region include river mouths with their estuaries,
coastal lagoons, coastal embayments, inner cayes, mid-lagoon cayes, barrier reefs and the open ocean
(Heyman and Kjerfve, 2000). Important coastal and marine resources include mangrove wetlands,
seagrass beds, barrier reefs, shrimp, marine turtles (green, hawksbill, leatherback, and loggerhead) and
manatees. Marine protected areas dot the coast, and include some dozen or more coastal and marine
reserves and parks.
Approximately half a million people live along the coast of the Gulf of Honduras, whereas some 12.4
million people live in the adjacent watersheds. Major coastal population centers include Puerto Barrios
and Livingston in Guatemala, San Pedro Sula and Puerto Cortés in Honduras, and Punta Gorda and
Belize City in Belize. Shipping, bananas, fisheries (both subsistence and export), and tourism are major
industries of the region.
2.1
Watershed
The watersheds of the Gulf of Honduras make up some 53,700 km2, distributed with about 5,800 km2 in
Belize, 18,300 km2 in Guatemala, and 29,600 km2 in Honduras.
June 2, 2003
4
Abt Associates Inc. / Woods Hole Group
Preliminary TDA
2.1.1
Drainage Basins
The Project Area within the Gulf of Honduras region is influenced by eight primary watersheds (Figure
2.0-2), whose total area is about 53,700 km2 (Table 2.1-1). There are eighteen subsidiary watersheds in
Belize (Table 2.1-2), three primary watersheds in Guatemala, and four primary watersheds in Honduras,
within the project area. Numerous rivers drain each watershed, but the main rivers are the Sarstoon, Rio
Dulce, Motagua, Chamelecon and Ulua.
Table 2.1-1. Major Watersheds of the Gulf of Honduras
Watershed Name
Countries
Watershed Area (km2)
Major Rivers
Maya Mountains*
Belize
5,800
Sittee River, Swasey
Branch, Rio Grande, Moho
River
Sarstoon
Guatemala, Belize
2,218
Sarstoon River
Rio Dulce -- Laguna Guatemala
3,435
Rio Dulce
Izabal
Motagua
Guatemala,
12,670 (2,141 of which
Motagua River, San
Honduras
are in Honduras)
Francisco River, Piteros
River, Canal de los
Ingleses
Chamelecon
Honduras
4,350
Chamelecon River
Cuyamel
Honduras
2,141
Motagua
Ulua
Honduras
21,230
Ulua River
Lean I
Honduras
3,045
Lean River
Table 2.1-2. Subsidiary Watersheds of Belize
Watershed Name
Watershed Area (km2)
Major Rivers
Freshwater Creek
225
Freshwater, Black Ridge, and
Silk Grass creeks
Sittee River
457
Sittee River and Cocoa, Pull
Shoes, and Blackwater branches
Cabbage Haul Creek
104
Cabbage Haul Creek
South Stann Creek
261
Sittee, Cockscomb, Mexican and
Juan branches of South Stann
Creek
Santa Maria Creek
151
Santa Maria and Silver creeks
Mango Creek
250
Mango Creek
Big Creek
59
Big Creek
Sennis River
76
Sennis River
Pine Ridge Creek
40
Pine Ridge Creek
Monkey River
1,290
Monkey River
Freshwater Creek
138
Freshwater and Payne's creeks
Deep River
352
Big Dry Creek, Machaca Creek,
Warrie Creek, and Deep River
Channel
Golden Stream
206
Golden Stream
Middle River
51
Middle River and Seven Hills
Creek
Rio Grande
727
Rio Grande and Columbia Branch
Moho River
822 (1,189 total)**
Moho River
Temash River
364 (475 total)**
Temash River system
Sarstoon River*
194 (2,218 total)**
Sarstoon River
June 2, 2003
5
Abt Associates Inc. / Woods Hole Group
Preliminary TDA
*Shared by Guatemala and Belize
** unbracketed: drainage area in Belize; in parentheses --- total drainage basin area
2.1.2
River Discharge
Few discharge measurements have been made in the Caribbean watersheds of the Gulf of Honduras, and
those that do exist are generally of short duration, some installed following Hurricane Mitch in 1998 in
order to assist flood disaster planning and prevention. The major rivers are shown in Figure 2.1-1 and
characteristics listed in Table 2.1-3.
Figure 2.1-1. Rivers in the Gulf of Honduras Watershed
(See Appendix D)
Table 2.1-3. Major Rivers Entering the Gulf of Honduras
River Name
Country (ies)
Length (km)
Mean Discharge
(m3/sec)
Sittee River
Belize
32
Stann Creek River
Belize
40
Swasey Branch
Belize
27
Monkey River
Belize
63
Rio Grande
Belize
26
Moho River
Belize
37
Sarstoon
Belize (Black Creek)/
42
160*
Guatemala (San Pedro)
Rio Dulce
Guatemala
42
300*
Motagua
Guatemala
487
530*
San Francisco
Guatemala
Piteros
Guatemala
Ulua
Honduras
358
690* (1,400**)
Chamelecon
Honduras
256
370 * (400**)
* Heyman and Kjerfve, 1999
** Comision Ejecutiva Valle de Sula, 2002
The largest rivers are in Guatemala and Honduras. Due to the proximity of the Belize Maya Mountains to
the coast, the rivers in Belize are more numerous, but smaller in terms of water discharge. The mean
water discharges for the rivers in Belize are 10 to 20 times smaller than those in Guatemala and
Honduras.
Monthly discharge patterns reflect the seasonal rainfall distribution. Figure 2.1-2 shows the seasonal
discharge pattern for the Rio Grande River in Belize. Maximum discharge coincides with the rainy
season (June through October). Lower discharges occur in other months.
June 2, 2003
6
Abt Associates Inc. / Woods Hole Group
Preliminary TDA
Figure 2.1-2. Monthly Average Discharge for the Rio Grande River, Honduras
Monthly Average Discharge for Rio Grande River
(cubic meters per second)
70
60
50
40
1981-1995
30
20
10
0
January
March April May June JulyAugust
February
October
September November
December
The total mean discharge of rivers to the Gulf of Honduras listed in Table 2.1-3 is about 2,200 m3/sec.
Heyman and Kjerfve estimate a total discharge to the Gulf of 2,400 m3/sec, equivalent to about 76 km3 a
year. FAO estimates a discharge of 43 km3 per year from the Guatemalan rivers, 16 km3 a year from the
Project Area of Honduras (of about 75 km3 a year produced by all of Honduras into the Caribbean), and
about 15 km3 a year from Belize (a total FAO estimate of 74 km3 per year). All three estimates are
relatively similar, giving added confidence to these estimates.
The primary discharge patterns are reflected in the ecology of the region. The small discharges along the
Belize coast are associated with an extensive barrier reef (the second largest in the world after Australia's
Great Barrier Reef). As the influence of the Guatemalan and Honduran rivers is felt, however, the reefs
are not present as continuous barriers. This situation reflects changes in the hydrography, including
visibility, nutrient input, water clarity, sediment inputs, etc.
2.1.3
Sediment Discharge from Rivers
Few data exist on sediment discharge to the Gulf of Honduras. Belize has two types of drainage: one in
the steeper Maya mountain area to the north of Belize, and a second southern coastal plain having lower
slopes. In general, the rocks of the Maya Mountains in Belize are granitic and metasedimentary in nature,
and therefore may erode more slowly than sedimentary rocks of the south. The steep slopes of the
Belizean drainage to the Caribbean suggest that the sediments will be coarse in grain size, and there will
be less than in the much larger rivers of Guatemala and Honduras. This is not to say that the specific
sediment transported yield of the rivers (volume of sediment per unit area) in Belize is smaller than in the
other two countries. In fact, the specific yield may be greater in Belize than the other countries due to its
steeper slopes. Data do not allow determination of the specific yield for all rivers, which represents a
trade-off between the slope of the river/watershed, and the geological materials being eroded.
Human activities can also affect the sediment yield from these areas. Deforestation, agriculture, sand
mining from rivers and construction of dams and reservoirs, all can affect the sediment yield from rivers.
Dams and mining are occurring in all three countries, so sediment yield to the coast is even more
June 2, 2003
7
Abt Associates Inc. / Woods Hole Group
Preliminary TDA
uncertain. Since coastal stability depends in large part on sediment availability, at least in the Guatemalan
and Honduras regions, more gauging stations may be required for coastal zone management purposes.
Limited data on sediment discharge was collected by WRIScS (2001). They monitored suspended
sediment load in the North Stann Creek and Sittee Rivers, and compared those to South Stann Creek.
They estimated a total specific yield for suspended sediments of 32 to 53 tons per km2 per year for 1999,
about 85 % of which came during the rainy season. The total suspended sediment load estimates range
from 2,000 tons per rainy season (North Stann River) to 14,000 tons per rainy season (Sittee River).
These estimates underestimate the total sediment load, since this study did not measure bedload transport.
As part of this study, the erosion potential and potential sediment load were estimated, by assuming an
average concentration of suspended sediments in the rivers. These estimates have large error bars.
From a transboundary context, the natural and human-accelerated sediment delivery to the Gulf plays a
major role. Regional exchange of sediments from rivers occurs through transboundary currents, and
allows dispersal anywhere in this eco-region.
2.1.3.1 Potential Erosion
In order to have a perspective on the erosion problems of the Gulf of Honduras, an analysis was
performed considering three important factors for the erosion process which are: land cover, slope and
rainfall. Overlays of digitals maps for these factors were used in order to generate a map of potenial
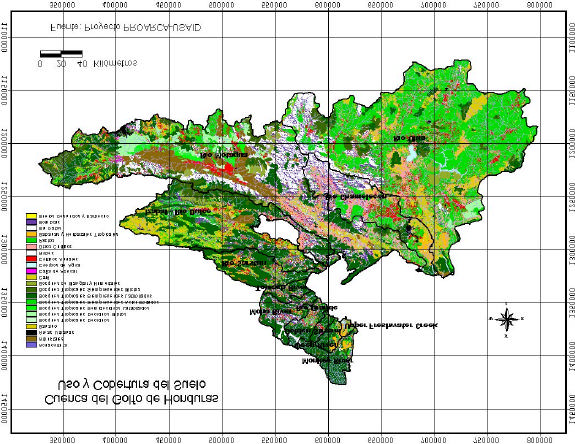
erosion for the watershed. The land use map shown in Figure 2.1-3 was used together with digital
elevation maps provide by the USAID-PROARCA project. The digital layers were overlaid to generate
an index by pixel which aggregation results in the erosion potential map. The erosion index was
determined by multiplying for each pixel the slope with a cover factor, which is a function of the land use.
The cover factor was the C factor of the Universal Soil Loss Equation (USLE). The minimum values used
for each land use were: forest = 0.001, shrubs = 0.030, low vegetation, bare land = 0.500, intensive crops
= 0.200 y other crops and pasture = 0.100. Similar values to these ones have been derived in other
watersheds of Guatemala and other Central American countries (Abt, 2002).
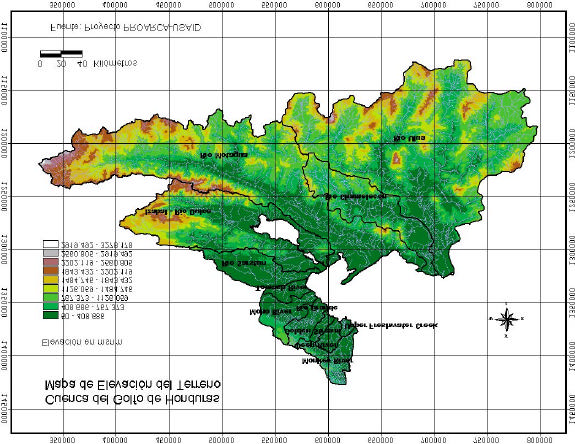
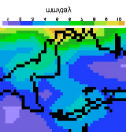
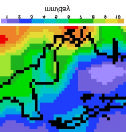
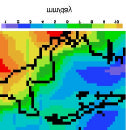
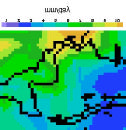
Figures 2.1-4 and 2.1-5 show the elevation and the slopes maps derived from the elevation map. Figure
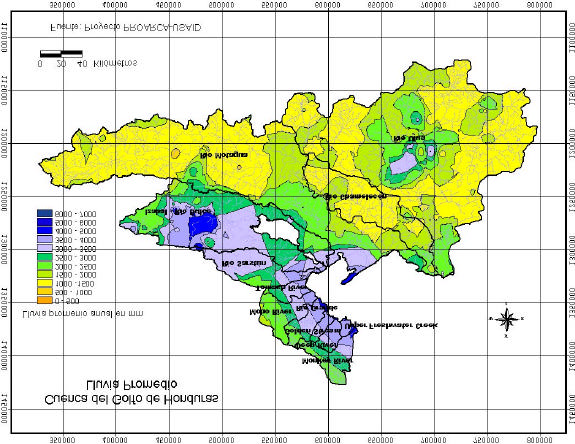
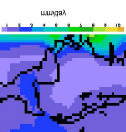
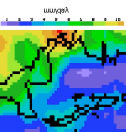
2.1-6 presents a map with the annual distribution of rainfall within the Gulf of Honduras watershed. .The
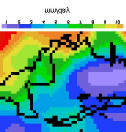
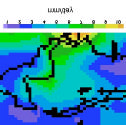
results of the superposition of these maps are presented in the map shown by Figure 2.1-7 which depicts
the potential erosion for the watershed. In this map the potential erosion in shown from low to high with
ranges of grey and green colours for low erosion potential to reds and black for high erosion. These
ranges were arbitrarily selected in order to be to show relative differences among the watersheds.
However, the digital map is very useful for planning watershed management interventions in areas with
land use conflicts like for instance intensive agriculture in high slope areas.
2.1.3.2 Sediment Rates
No information was found on sediment measurements of the tributaries of the Gulf of Honduras. In order
to get a "ball-park" estimate of the sediment contribution for rivers the average river discharges were
multiplied by an average concentration of sediments. To illustrate this Table 2.1-4 shows the average
discharges of the main tributaries to the gulf (Table 2.1-4) and the corresponding load assuming an
average concentration of 500 mg/L (Abt 2002). Sediment measurements in other watersheds of
June 2, 2003
8
Abt Associates Inc. / Woods Hole Group
Preliminary TDA
Guatemala oscillate between 50 and 3000 mg/L with an average around 500 mg/L. In other watershed
concentrations between 100 y 400 mg/L have been found for dissolved solids INSIVUMEH (2002).
Table 2.1-4. Preliminary Estimation of the sediment Loasd of the main tributaries of the Gulf of Honduras
River Name
Country (ies)
Mean Discharge
Sediment Discharge**
(m3/sec)
(ton/día)
Stann Creek River
Belize
40
1728
Monkey River
Belize
63
2722
Rio Grande
Belize
26
1123
Moho River
Belize
37
1598
Sarstoon
Belize, Guatemala
160*
6912
Rio Dulce
Guatemala
300*
12960
Motagua
Guatemala
530*
22896
Ulua
Honduras
690*
29808
Chamelecon
Honduras
370 *
15984
Total
95731
* Heyman and Kjerfve, 1999
**Asumes an average concentartion of 500mg/L
June 2, 2003
9
Abt Associates Inc. / Woods Hole Group
Preliminary TDA
Figure 2.1-3. Land Use Coverage Gulf of Honduras
June 2, 2003
10
Abt Associates Inc. / Woods Hole Group
Preliminary TDA
Figure 2.1-4. Digital Elevation Map- Gulf of Honduras
June 2, 2003
11

Abt Associates Inc. / Woods Hole Group
Preliminary TDA
Figure 2.1-5. Slope Map- Gulf of Honduras Watershed
June 2, 2003
12
Abt Associates Inc. / Woods Hole Group
Preliminary TDA
Figure 2.1-6. Average Rainfall- Gulf of Honduras Watershed
June 2, 2003
13

Abt Associates Inc. / Woods Hole Group
Preliminary TDA
Figure 2.1 -7. Erosión Potential Index- Gulf of Honduras Watershed
June 2, 2003
14
Abt Associates Inc. / Woods Hole Group
Preliminary TDA
2.1.4
Shoreline Classification
The shoreline of the region is highly variable, consisting of geologically-controlled structures to recent
sedimentary features. Belize's costal zone stretches approximately 375 kilometers, though only a portion
of this is in the Project Area. The geomorphology of this region is influenced by five parallel submarine
ridges of continental origin that trend NNE to SSW. These five ridges sit on a continental shelf that is
approximately 15 to 40 km wide, and which contains the 220 km long Belize Barrier Reef, extending
from the Mexican border in the north to Sapodilla Cays in the south. The southern half of the Belize
coast, the area within the Project Area, consists of sandy beach ridges and smaller coastal swamps. A
shelf lagoon exists along the southern part of the Belize coast, widening towards the south in effect
mirroring the width of the shelf. The coastal zone of the south is generally more diverse and richer than
that in the north. The Belize coast includes such diverse features as estuaries and lagoons, barrier beaches
with beach ridges and saline tidal swamps, cays, mangrove forests, seagrass beds, patch reefs, barrier
reefs and cays.
The Guatemalan coastline has a variety of habitats as well. Though lacking a barrier reef, the coast is
similarly diverse with vast mangrove areas (La Graciosa, Cocoli River, Santo Tomas, Punta Manabique,
Sarstoon-Temash), leading to river mouths and estuaries (Rio Dulce), the large Bahía de Amatique with
its vast shallow waters and sea grasses (Bahia Graciosas), the sandy Punta Manabique peninsula (an
accretionary feature built from riverine sediments from the east), and long beaches leading to the river
mouths of Motagua, San Francisco, and Piteros. These river mouths contain estuaries and various
important freshwater and coastal habitats.
The Honduran coastal area is marked by long beaches, vast mangroves, and offshore cays with corals and
mangroves. The major city on the coast, Puerto Cortés, has nearby beaches that are a tourist attraction.
The river mouths (primarily the Ulua) exhibit a rich vegetative growth, and contain important habitats.
The extensive coral reefs of Honduras are farther to the east of the Project Area.
2.1.5
Climate
2.1.5.1 Temperature
Temperatures in the study area tend to have small temporal variability due to the location of the Gulf in
the sub-tropical region. Temperatures are generally highest along the coast, with mean annual values of
approximately 28 degrees Centigrade. At higher altitudes, the temperature drops, such that the
temperature is about 20 degrees at altitudes of 500 to 1000 m. Much of the population lives at these
intermediate altitudes. The annual range of temperature is quite small.
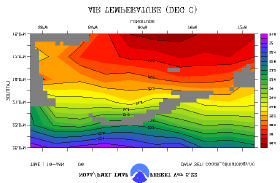
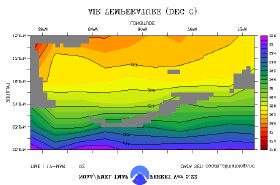
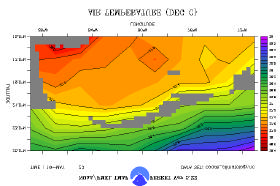
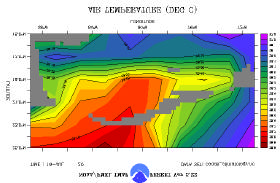
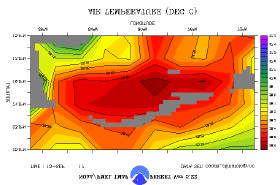
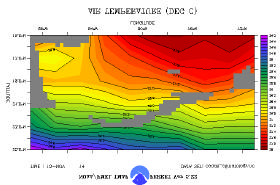
Figure 2.1-8 shows a regional view of mean monthly temperatures in the overall Caribbean Sea, as well
as in the Gulf of Honduras. Temperature fluctuations over the Gulf of Honduras are on the order of a
couple of degrees Centigrade.
June 2, 2003
15
Abt Associates Inc. / Woods Hole Group
Preliminary TDA
Figure 2.1-8. Mean Monthly Temperatures for the Gulf of Honduras Marine Area
2.1.5.2 Precipitation
The climate of the Gulf of Honduras falls within the Rainy-Warm type, and presents two distinct climatic
periods. A rainy season lasts from June to October with the highest levels of rainfall and humidity,
reduction in wind speed, and higher temperatures. The dry season lasts from November to May, and is
characterized by a reduction in temperature and rainfall (Porting, 1976). These seasonal variations of
meteorological conditions in the area are caused by north-south migrations of the Intertropical
Convergence Zone (ITCZ), which is found near the equator in winter and at about 10°N at the end of
summer season.
The yearly rainfall averages from 3,000 to 4,000 mm in the coastal regions of the western Cayman Sea
(Galleges, 1996; Heyman and Kjerfve, 2000) and up to 10,000 mm per year in the Maya Mountains. At
the same time, the offshore areas of the Gulf of Honduras get approximately 40% of the mainland rainfall.
June 2, 2003
16
Abt Associates Inc. / Woods Hole Group
Preliminary TDA
This estimate is based on measurements at Carrie Bow Cay from 1976 through 1980 (Rützler and
Ferraris, 1982). Air temperatures in the Gulf vary seasonally from 23°C in winter to 28°C in summer
(Heyman and Kjerfve, 2000).
Rainfall is presented in Figures 2.1-9 and 2.1-10. Figure 2.1-9 shows the monthly patterns of
precipitation, with the higher values over the mountainous areas and lower values over the Gulf itself.
The rainy season patterns are clearly demonstrated. Figure 2.1-10 shows the monthly mean precipitation
over the Gulf of Honduras, ranging from a low of 50 mm per month in the dry season, to about 275
mm/month in the rainy season. The rainfall in the interior mountainous areas is much larger.
Figure 2.1-9. Regional Precipitation Patterns in the Gulf of Honduras
Jan
Feb
Mar
Apr
May
Jun
Jul
Aug
Sep
Oct
Nov
Dec
Source (http://orbit35i.nesdis.noaa.gov/arad/gpcp/)
June 2, 2003
17
Abt Associates Inc. / Woods Hole Group
Preliminary TDA
Figure 2.1-10. Mean Monthly Precipitation in the Gulf of Honduras
Precipitation in the Gulf of Honduras
300
250
200
150
mm/month 100
50
0
1 2 3 4 5 6 7 8 9 10 11 12
months
2.1.5.3 Winds
Winds are important to water quality in that they generate currents, thus affecting mixing and advection,
and create waves, which resuspend bottom sediments causing higher turbidity. Recent evidence
(WRIScS, 2001) indicates that resuspension is as influential as river flooding in generating turbid water in
the coastal zone of the Gulf.
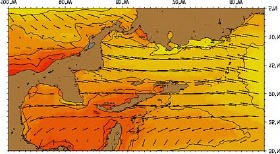
In the Gulf of Honduras, the wind pattern is dominated by northeasterly trade winds during the year
(Figure 2.1-11) with speeds ranging from 3 to 8 m/s. The winds in the Gulf are stronger during winter
months when the ITCZ shifts south. In summer, the southward component of the trade winds is minimal.
June 2, 2003
18
Abt Associates Inc. / Woods Hole Group
Preliminary TDA
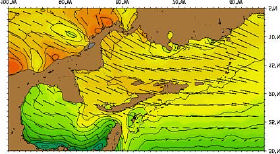
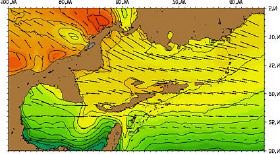
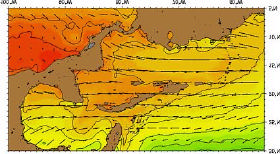
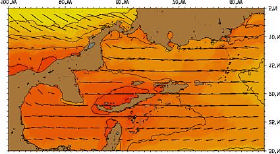
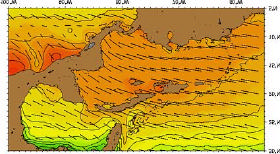
Figure 2.1-11. Seasonal Evolution of Sea Surface Temperatures (Pathfinder AVHRR) and Surface Winds
(NCEP/NCAR Reanalysis Project) for the Caribbean Sea.
January
March
May
July
September
November
Each month represents an eleven-year average from 1985 through 1995 (from Samuels, 2002).
Typical synoptic meteorological features that cause variations in speed and direction of trade winds and
other changes in meteorological conditions are `weekly' easterly waves, some of which develop into
tropical storms and hurricanes causing transient circulation, mixing, coastal upwelling and storm surge
(Mooers and Maul, 1998). During winter months, occasional cold-air outbreaks from the north (called
`northers') associated with the passage of the polar atmospheric front cause strong winds from the north
and drops in air temperature.
2.1.5.4 Hurricanes
Tropical storms and hurricanes regularly cross the Gulf of Honduras between August and October. The
frequency of tropical storms increases from south to north, being 20 storms per century of the area of the
Bahía de Amatique and up to 60 storms per century at the northeastern limit of the Gulf of Honduras
(Heyman and Kjerfve, 2000). A recent example of a hurricane that impinged upon the area of the Gulf
was category 5 Hurricane Mitch, which hit the region in October 1998 causing devastating effects on
June 2, 2003
19
Abt Associates Inc. / Woods Hole Group
Preliminary TDA
coastal areas. For example, precipitation estimates for Mitch for the total storm event in Honduras and
Nicaragua have ranged from 1,200 to 1,800 mm for locations receiving the heaviest rainfall (National
Climatic Data Center, 1999).
The patterns of hurricanes reaching the Gulf of Honduras are indicated in Figure 2.1-12. Most hurricanes
trend east-to-west, however, some recurve and display complex tracks. East-to-west trending hurricanes
generate their largest winds in the southwest direction, towards the coasts.
Figure 2.1-12. Map of Hurricane Tracks in the Gulf of Honduras, 1921-1999
(See Appendix D)
2.2
Geology and Geomorphology
The geology of the Gulf of Honduras region is quite complex, being situated in an area of active tectonics
(illustrated by strong seismicity and active volcanism). The marine portion of the region reflects the
presence of active marine dynamics, including subduction and collision tectonics. The deep Caribbean
basin with its chain of islands is a reflection of these complex dynamics. The landward portion reflects
both modern processes of volcanism and alluvial processes, but also ancient metasediments.
2.2.1
Geology
The geology of Belize consists primarily of three types of formations. The northern, hilly Maya
Mountain region consists of metamorphosed sediments (metasediments) and granitic intrusions, whereas
the southern area consists of alluvial material. The metasediments are the oldest rocks in Belize, dating to
the Paleozoic era at 300 million years old. These are part of the Santa Rosa Group, comprised of fine-
grained phyllites, sla tes, and mudstones. The coastal plain sediments are young, dating to the tertiary
period at about 10 million years. These sediments are thought to be of riverine, not marine, origin.
Primary soil types are Ossory (derived from metasediments), Stopper (derived from granitic rocks),
Melinda (derived from alluviual material), Puletan (also from alluvium), and tintal soils (wet, swampy
type soils).
The geology of Guatemala is more complex, consisting of four primary physiographic units: coastal
plain, Izabal Depression, sedimentary highlands, and Motagua depression. Soils are mixed, and include
the Inca, Chocon, Chacalate, Alluvial, and Manabique soil types. UNEP (1995) provides a brief
description of these soils. The coastal plain consists primarily of alluvial material from the Quaternary
era. The sedimentary highlands are comprised of carbonates of the Mico Mountains, well-known for its
karst topography. The Motagua depression is floored by Quaternary era alluvium as well, and includes
the Punta de Manabique, a large, sandy barrier.
The geology of Honduras within our study area consists primarily of the following units. The coastal
areas consist mainly of Quaternary and Cretaceous rocks, primarily consisting of alluvium and intrusive
units. The lithology of the alluvium unit is mainly surficial bounders, cobbles, gravel, sand, and mud
while the intrusive unit consists of granite, granodiorite and diorite. The origin of the alluvium is
sedimentary while the intrusive rocks are plutonic in orig in. The environment of deposition for the
alluvium is continental marine.
June 2, 2003
20
Abt Associates Inc. / Woods Hole Group
Preliminary TDA
Intermediate (or farther south) from the coastal plain is a Paleozoic unit called Cacaguapa Shist, a
metamorphic rock with an unknown environment of deposition. This unit consists of rocks such as schist,
phyllite, gneiss, quartzite, marble and quartz veins.
The mountainous areas to the south are Tertiary and Cretaceous in age and are from the Matagalpa, Patre
Miguel, and Yojoa formations. These rocks are pyroclastic, volcanoclastic (tuff), and sedimentary mixed
rock types, respectively. The environment of deposition for the Matagalpa and Padre Miguel formations
is continental and the Yojoa is marine in origin.
The primary soil types in the Honduras coastal areas are beach sands, alluvial sediments, marshes and
bogs and various silty loam soils.
2.2.2
Coastal Processes and Coastal Erosion
The Gulf of Honduras has quite a mixed range of coastal processes occurring within it. Along the Belize
sector of the Gulf, the shoreline is characterized by a vast barrier reef of more than 200 km in extent,
which protects the shoreline from open Caribbean wave action. Waves are generally locally generated
within the lagoon. The numerous small rivers along the Belize coast provide some sediment to the
shoreline, but not an excessive amount. In general, the littoral transport is from north to south, though the
magnitude of this transport has not been estimated. Numerous types of shorelines exist (see section
2.1.4), some of which are sandy beaches, but many of which are mangroves, swamps, etc. This north-to-
south littoral drift is primarily wave-driven, but parallels the general southward residual drift of the
coastal currents.
Within Guatemala, the littoral transport is varied. Along with the western side of the Bahía de Amatique,
the littoral transport is to the south, and sediments from the rivers there nourish the attractive beaches to
the south. Due to the protection afforded by the northern reefs and the bay itself, littoral transport is
somewhat slow. In the central and eastern portions of the Bahía de Amatique, open Caribbean waves
cannot propagate. This central protected area is characterized instead by locally generated waves, and
relative stability of the coast and sea floor. Hurricanes are the dominant destabilizing force in this region,
and rivers bring continual sediments to the coastal areas. Along the northeast portion of the Guatemalan
coast, from the Honduras border to the tip of the Punta de Manabique, the littoral transport is on average
from west to east, though transport at any given time may be in either direction depending on the wind
conditions. This section of shoreline is exposed to open Caribbean waves, and likely has the largest
waves of the Guatemalan coast. Fortunately, the rivers of Guatemala and Honduras provide a sufficient
sediment supply, so coastal accretion dominates over erosion, as evidenced by the growth of Punta de
Manabique over historical time periods (despite some localized episodes of erosion).
Along the Honduran coast, the general littoral transport is from west to east also, as the open Caribbean
waves approach the shoreline mainly from east to west. The rivers of Honduras tend to nourish the coast,
although coastal indentations (at Puerto Cortés, for example) may create local areas of erosion. In
general, the beaches of Honduras appear to be relatively stable and sandy.
2.3
Oceanography
This section describes oceanographic conditions in the Gulf of Honduras and adjacent Caribbean Sea. The
introduction sub-section gives a brief background on the oceanography of the western Caribbean Sea.
The focus of sub-sections 2.3.1 and 2.3. is on the space-time variability of basic properties of seawater,
June 2, 2003
21
Abt Associates Inc. / Woods Hole Group
Preliminary TDA
such as temperature, salinity, transparency, and water chemistry, as well as on the circulation patterns that
cause variations in seawater characteristics.
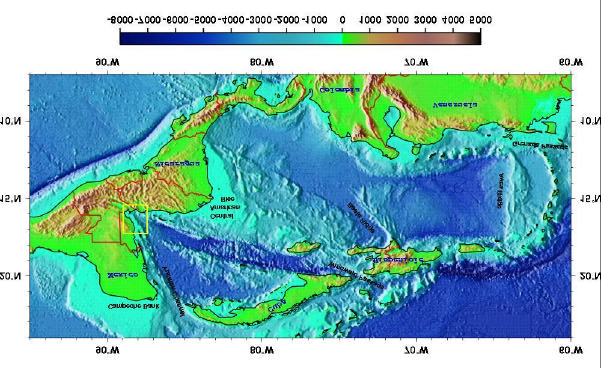
The topography of the Caribbean Sea (Figure 2.3-1) shows a succession of five deep basins separated by
sills of less than 2000 m depth and set apart from the main Atlantic basins by a chain of islands. Several
passages that connect the sea with the Atlantic Ocean have sill depths of 740 -2200 m. The sea has more
than one connection with the main ocean basins. The northern basin is connected with the Gulf of
Mexico through the Yucatan Strait.
On average, evaporation exceeds precipitation throughout the Caribbean Sea (Etter et al., 1987). The
excess of evaporation over precipitation is not balanced by freshwater inputs from rivers on a basin wide
scale, which makes this American Mediterranean Sea a concentration basin. The annual mean salinity,
averaged over the upper 200 meters, increases from 36.09 at the inflow through the Lesser Antilles to
36.19 in the Yucatan Strait (Etter et al., 1987). These surface salinities are relatively low due to the
influence of Amazon and Orinoco River water, however. Therefore, the density increase associated with
the concentration process is insufficient to overcome strong density stratification and cause deep vertical
convection. As a result, deep-water renewal occurs due to sporadic inflow of oceanic water from outside
(Wust, 1964).
The Amazon River and Orinoco River waters are advected to the northwest with the Caribbean Current.
On average, 15 -20% of the surface water that enters the Caribbean Sea is derived from the brackish
waters of the Orinoco and Amazon River estuaries (Moore et al., 1986). The influence of river runoff is
strongly seasonal, with strongest flow occurring between May and November, that is, during the wet
season.
Freshwater inputs from local rivers play a significant role in modifying stratification and formation of
buoyancy driven circulation patterns on regional space scales (Murray and Young, 1985). Therefore, the
Caribbean Sea is highly stratified in the upper 1200 m of the water column; weakly stratified between
1200 and 2000 m; and nearly homogeneous below 2000 m. This water structure is directly related to the
sill depths of the Antilles Islands arc, which impede the flow of deep water into the Caribbean (Gordon,
1967).
Water masses entering the Caribbean originate in both the North Atlantic and the South Atlantic oceans.
Several water masses can be distinguished in the Cayman basin (Wust 1964; Gordon 1967; Sukhovey,
1980; Gallegos, 1996). The surface water mass occupies the upper 50 m of the water column. It has
salinity around 36.0 in winter and 35.8 in summer. Below the surface water lies the subsurface layer
(Subtropical UnderWater (SUW)) occupying a depth from about 50 to 250 m. The core of this water
mass is located at about 100-m depth. It forms the salinity maximum, with salinity around 36.5 and
temperature in the range of 21 to 23°C. The next 500 m layer of the water column is dominated by
Western North Atlantic Central Water (WNACW) with a typical temperature range of 20 8°C and
salinity range of 36.3 - 35.2. Deeper, at about 700 m, the characteristic salinity minimum of Antarctic
Intermediate Water (AAIW), salinity near 34.9 and temperature near 7°C, can be traced through the
Caribbean Sea. The deep waters are remarkably uniform, with temperature of about 4°C and salinity of
about 35.
The main circulation feature of the Caribbean Sea (Figure 2.3-1) is the Caribbean Current (Wust, 1964;
Gordon, 1967; Kinder, 1983; Kinder et al., 1985), the throughflow carrying waters from the Atlantic
Ocean into the Gulf of Mexico with a mean transport (Gallegos, 1996) of about 30 Sv (1 Sv = 106m3/s).
In the western Caribbean, the mean velocity of the Caribbean Current is about 0.5 m/s (Fratantoni, 2001).
June 2, 2003
22
Abt Associates Inc. / Woods Hole Group
Preliminary TDA
Its intensity has a strong seasonal cycle (Gallegos, 1996) with higher current velocities during spring-
summer time (about 0.8 m/s) and slower currents during autumn-winter months (about 0.4 m/s).
June 2, 2003
23
Abt Associates Inc. / Woods Hole Group
Preliminary TDA
Figure 2.3-1. The Caribbean Basin: Bathymetry and Circulation
The circulation in the Caribbean experiences much variation in both space and time, some of it in the
form of mesoscale eddies and meanders of the Caribbean Current (Mooers and Maul, 1998; Andrade and
Barton, 2000). The major mechanisms that may cause generation of the mesoscale eddies in the western
Caribbean are interaction of the Caribbean Current with bottom topography (Molinari et al., 1981), wind
forcing, and shear instability of the flow. Quasi-permanent cyclonic eddies are formed between the
Caribbean Current and the coast in the Colombian and Cayman basins. High-resolution numerical
models (Navy Layered Ocean Model, for instance) reveal that an anti-clockwise rotating (cyclonic) eddy
is a quasi-permanent circulation feature in the western Cayman Sea
(http://www7320.nrlssc.navy.mil/global_nlom/globalnlom/ias.html). It determines flow variability in the
deep part of the Gulf of Honduras. Coastal circulation is driven by wind and buoyancy fluxes formed by
river runoff and rainfall (Murray and Young, 1985).
The Gulf of Honduras is part of the Cayman basin of the western Caribbean Sea (Figure 2.3-1). This
water body has an area of about 10,000 km2. It includes Bahía de Amatique, the entire Caribbean coast of
Guatemala, the eastern part of the coast of Honduras, and the southern part of the Belize Barrier Reef
Lagoon. The western part of the gulf, about 60 km off shore, is rather shallow (0 30 m). Several coral
reefs, which form the southern portion of the MesoAmerican Barrier Reef System (MBRS), are located at
the northwest border of the Gulf. Large freshwater inputs from the Motagua, Sarstoon and Dulce Rivers
limit reef development in the central part of the Gulf to a few isolated corals and small patch reefs, such
as Hunting Cay, for instance. The northeastern part of the Gulf includes a portion of the deep Cayman
Trench. The continental slope is rather steep and the water depth drops abruptly from about 30 m at the
shelf break to 2000 m depth in the northeast. Therefore, one can expect that both coastal and open ocean
processes may play a role in driving circulation dynamics and determine variability of seawater properties
in the Gulf of Honduras.
June 2, 2003
24
Abt Associates Inc. / Woods Hole Group
Preliminary TDA
2.3.1
Seawater Properties in the Gulf of Honduras
2.3.1.1 Seawater Temperature
Water temperature is an important parameter for a tropical coastal ecosystem because reef corals are
sensitive even to subtle changes in water temperature. The temperatures at which they grow best are
between 25°C and 29°C. Increase in water temperature eventually causes coral bleaching and decay
(Kramer and Kramer, 2000). In spite of that, data on the variability of water temperature in the Gulf are
scarce and fragmentary. While seasonal variability is well documented on a basin scale on the basis of
satellite data, little is known about regional peculiarities of space-time distribution of seawater properties
in the Gulf.
Long-term averages of remotely-sensed sea-surface temperatures (SST) for the Caribbean Sea (Figure
2.3-2) reveal little changes within the seasonal cycle. According to these data SST in the Gulf of
Honduras varies within a range from 27°C (January February) to 29°C (August September). Brenes
et al. (2001) studied time variations of sea-surface temperature at a specific location (Cayos Cochinos) in
the area adjacent to the eastern boundary of the Gulf of Honduras using high-resolution data from NOAA
- 12 and NOAA - 14 polar orbiting satellites. Sea surface temperature data were also obtained in situ to
ground truth remote observations.
The data showed a well-defined seasonal cycle (Figure 2.3-2), in which low temperatures observed during
the first months of the year were mainly associated with coastal upwelling that occurred in response to
seasonal intensification of the trade winds on a local scale. At the same time, the open sea area showed a
similar decrease in temperature due to intensification of open sea upwelling within the cyclonic mesoscale
eddy (sub-section 2.3.3). Summer temperatures were approximately 1°C higher than could be expected
from mean climatological data.
Figure 2.3-2. Surface (left) and Bottom (right) Water Temperature Variations at Cayos Cochinos in 1993
1996.
Source: Koltes et al., 2002
Seawater properties in the coastal zone of the western part of the Gulf were measured in February 1999
(PROARCA COSTAS, 2003) in the region of the Snake Cays (Port Honduras area). The data showed
that sea surface temperature varied during the period of the survey in the range from 29 to 32°C, which is
about 2°C higher than could be expected from mean climatological estimates. In 2001, a typical
thickness of the upper mixed layer (UML), which has vertically uniform temperature and salinity, was
about 15 m in the northwest portion of the Gulf (WRIScS, 2001). The temperature showed a vertical
distribution with coolest waters at depth offshore and warmest waters at the surface and inshore. The
June 2, 2003
25
Abt Associates Inc. / Woods Hole Group
Preliminary TDA
temperature range was from 28.5 to 31°C. A thermocline developed in the offshore areas at depths of 15
20 m. It is possible that the thermocline did not exist in shallower areas due to wave -induced mixing.
2.3.1.2 Seawater Salinity
The open sea surface salinity in the western Caribbean Sea is rather uniform with values around 36.2
(Sukhovey, 1980; Gallegos, 1996). The coastal water salinities may vary over a wide range from 5 to 35
(Figure 2.3-3), with lowest salinities observed close to major rivers. On average, offshore salinities are
almost constant throughout the dry season (until June), then drop dramatically in July August, and
gradually increase in September November (CZMAI, 1999).
Throughout the year, the lowest salinities in the Gulf are found in the Bahía de Amatique, a shallow
estuarine basin. It is a body of semi-enclosed coastal waters with a connection to the sea and in which
salinity is considerably diluted due to the influence of freshwater discharged from land. In this shallow
water body, with an average depth of less than 10m, salinity fluctuates throughout the year from 10
(during wet season) to 30 (during dry season). During the rainy season, there is a clear gradient with
salinities from almost zero salinity at the mouths of the Sarstoon, Laguna Izabel, and Motagua rivers to 16
in the outermost part of the bay (Yańez-Arancibia, 1994; Salaverría and Rosales, 1993). There is also
vertical stratification of salinity, with average bottom salinity values of 33.7. Higher bottom salinities
occur due to the estuarine-type circulation, with a shoreward flow of open seawater near the bottom,
creating a `salt wedge', and a seaward flow in the surface layer (Figure 2.3-4). The circulation is formed
due to the existence of a density gradient, which forces freshwater to move offshore and overlay more
saline (denser) open seawater.
Observations during 2001 in the northwestern portion of the Gulf revealed salinity values from 33.5 to
34.8, with readings increasing with depth and decreasing shoreward (WRIScS, 2001). The range of
salinity variations in this area was thus much less than the range of salinity variability in the survey area
at Snake Cays (Figure 2.3-3). Other observations (WRIScS, 2001) indicate that salinity even along the
inner reef margins can fall to about 32 during periods of intense river flooding.
June 2, 2003
26

Abt Associates Inc. / Woods Hole Group
Preliminary TDA
Figure 2.3-3. Surface Salinity Distribution in the Snake Cays (Western Gulf)
June 2, 2003
27
Abt Associates Inc. / Woods Hole Group
Preliminary TDA
Figure 2.3-4. Schematic Representation of Salinity Distribution and Flows in a Typical Estuarine System
Source: Tomczak, 1996
2.3.1.3 Water Transparency
Water transparency is a critical parameter for a tropical marine system, because coral reefs need low
turbidity water to maintain their life cycle. Water clarity is also an indication of the amount of suspended
solids and/or primary biological productivity. Typically, the transparency is measured as a depth at which
a white disk, the so-called Secchi disk, is no longer visible from the surface.
Secchi disk depth measurements were routinely made in the northwest part of the Gulf from March to
September 2001 (WRIScS, 2001). These field studies showed that seawater transparency increased
eastwards from about 4 meters in the near-shore area to a maximum of 33 m observed in March (dry
season) in a relatively deep channel (approximately 30 m depth) on the inner side of the barrie r reef.
Farther offshore water transparency decreased to about 23 m.
A similar pattern with the clearest water (darker area) can be observed on the inner side of the barrier reef,
seen in Figure 2.3-5, that is, in the area not exposed to the impact of wind waves and swell. From this
area this transparent seawater is advected toward the southern coast of the Gulf (Figure 2.3-5).
Near the coast and close to river mouths, water transparency may drop to less than 1 m even during dry
season (Figure 2.3-6) indicating that rivers are not only a source of terrigenous material but they are a
source of nutrients that increase phytoplankton productivity.
June 2, 2003
28
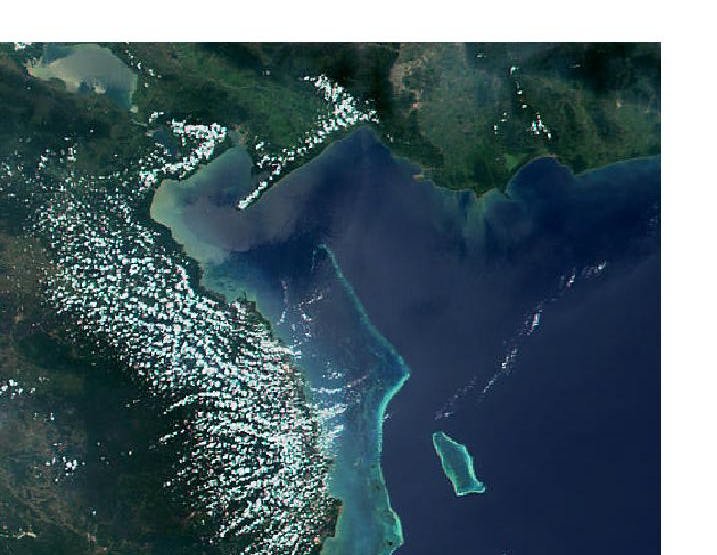
Abt Associates Inc. / Woods Hole Group
Preliminary TDA
Figure 2.3-5. AQUA MODIS (Moderate Resolution Imaging Spectroradiometer) image of the Gulf of
Honduras Area (MODIS Band Combination: 1, 4, 3) Showing a Pattern of Low Turbidity
Water Formed on the Inner Side of the Barrier Reef
June 2, 2003
29
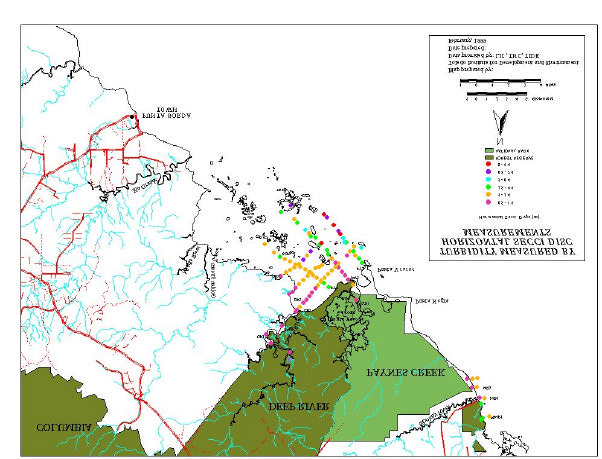
Abt Associates Inc. / Woods Hole Group
Preliminary TDA
Figure 2.3-6. Seawater Transparency Distribution Close to Deep River Mouth in February 1999
Sou
rce: PROARCA COSTAS, 2003
2.3.1.4 Water Chemistry
The major source of information on space-time variability of chemical parameters describing water
quality in the Gulf of Honduras is the data collected on a regular basis throughout 1998-99 at several
locations in the western part of the Gulf (Port Honduras) in the framework of the Belize Water Quality
Monitoring Program (CZMAI, 1999). These data provide a description of temporal variability of major
biochemical parameters, such as the dissolved oxygen (DO), pH, nitrate, phosphate, and chlorophyll-a, in
the lagoonal, estuarine and open shelf environments.
Dissolved oxygen concentration in seawater is one of the important characteristics of marine ecosystems.
There are two major biochemical processes that control the level of DO in seawater. These processes are
photosynthesis and respiration. DO concentrations are also a function of water temperature and salinity.
In 1998-99 the values of DO concentration ranged from 5.2 to 9.6 mg/l. The lowest values were found in
the areas of wastewater discharge, which also correlated with elevated levels of organic matter. In other
areas, such as parts of the Bahía de Amatique without bottom vegetation, DO concentrations can drop to
June 2, 2003
30
Abt Associates Inc. / Woods Hole Group
Preliminary TDA
0.9 mg/l (Yańez-Arancibia et al., 1994) due to high oxygen consumption resulting from organic matter
decomposition. High DO concentrations were found in areas close to coral reefs, also known for their
low primary productivity (depressed levels of organic matter).
The pH is another biochemical parameter that quantifies alkalinity of seawater. Same as dissolved
oxygen, pH of seawater depends on the process of respiration. Low pH may be brought about by carbon
dioxide, produced through decomposition of organic matter, dissolving in water and forming carbonic
acid. In the western part of the Gulf, the pH values ranged from 7.4 in lagoons and estuaries, to about 8.8
in the areas close to coral reefs. Lower values of pH were observed in the semi-enclosed Bahía de
Amatique (Yańez-Arancibia et al., 1994), where they ranged from 5.8 (no vegetation) to 7.4 (seagrass bed
of Thalasia testundinum).
Nitrates and phosphates are the biogenic elements crucial for maintaining high levels of primary
productivity. The main sources of these elements in coastal water are rivers, where nutrient
concentrations can be elevated due to agricultural activity in the area, in particular due to use of
fertilizers, and near sewage discharges. In the northeastern part of the Gulf, elevated concentrations of
nutrients may be associated with open sea and coastal upwelling during winter months (Yańez-Arancibia,
1994).
Nitrate and phosphate concentration measured at several sites ranged from undetected levels up to 7.0 µM
and 1.0 µM, respectively (CZMAI, 1999). Low levels of nutrient concentrations were consistently found
in open shelf areas and close to coral reefs. High concentrations appeared sporadically in the coastal
zone, which might be a result of nutrient load with river runoff and/or resuspecsion of sediments
(CZMAI, 1999).
Section 5.3.6 provides an estimate of the nutrient and BOD conditions for the entire Gulf. Except as cited
above, however, little quantitative field data exist to describe nutrient conditions on a time and space
averaged basis.
Chlorophyll-a concentrations, characterizing the level of primary productivity, ranged from undetected to
0.55 mg/l. The highest concentrations only slightly exceeded an approximate eutrophication threshold
(CZMAI, 1999).
2.3.2
Ocean and Coastal Currents
2.3.2.1 Large-Scale Circulation Patterns
The following processes determine shallow and open sea circulation in the Gulf of Honduras. The open
sea region is affected by basin-scale circulation features of the Caribbean Sea, the Caribbean Current, and
a quasi-permanent cyclonic eddy generated in the southwest corner of the Cayman Trench (Figure 2.3-7).
The formation of this cell of cyclonic circulation in the region is a combination of two different and
complementary dynamic phenomena. One might be associated with a dynamic response to the interaction
of the mean current with the coast of Central America. Another mechanism may be associated with the
local wind- and buoyancy-driven cyclonic circulation (Brenes et al., 2001). This cyclonic eddy is most
pronounced during winter months, when the ITCZ shifts south and trade winds intensify in the area of the
Gulf. The eddy is centered at about 19°N, 86°W (Heyman and Kjerfve, 2000), and the sea surface has a
negative 0.2 m height anomaly. The maximum current velocity at the periphery of the eddy is 0.2 to 0.4
m/s.
June 2, 2003
31
Abt Associates Inc. / Woods Hole Group
Preliminary TDA
Figure 2.3-7. Oceanographic Currents in the Gulf of Honduras
(See Appendix D)
The persistent northeasterly trade winds cause downwelling along the coast of Belize and thus the local
wind-driven circulation pattern can be described as a southward flowing cyclonic coastal current. Long-
term current measurements along the shelf edge in the Gulf north of Gladden Spit (Heyman and Kjerfve,
2000) indicate a persistent reef-parallel flow towards the south with the speed ranging from 0.1 to 0.2 m/s,
which was well correlated with local variations in wind speed and direction. This southward slow flow of
water persists for most of the year. It may sometimes reverse in summer and flow northward, as observed
in the months of September and October 2000 (WRIScS, 2001), when the southward component of trade
winds is minimal.
As shown by Brenes et al. (2001), the conditions favoring coastal upwelling can occur during winter
months in the eastern part of the Gulf. The associated wind-induced density gradients would cause a
long-shore westward flow, that is, a counter flow compared to the open sea current. The freshwater
inputs are at a minimum during the winter season so this westward current is not opposed by buoyancy-
driven circulation.
Buoyancy fluxes introduced by rainfall and river runoff during summer months and the associated
horizontal density gradients also favor the existence of a coastal cyclonic (counter-clockwise) current.
Murray and Young (1985) studied kinematic structure of such a coastal current associated with freshwater
fronts off the coast of Nicaragua. A similar structure of coastal flows should be expected along the coast
of the Gulf of Honduras. They showed that freshwater runoff results in a well-defined nearshore current,
extending 20 40 km out from the coast. Important terms that drive the dynamics of a front are the
Coriolis and frictional forces (eddy diffusivity). This coastal current can be characterized by a
pronounced maximum in the along-shelf current velocity (up to 0.6 m/s) about 10 km off the coast, a
complex cross-shelf velocity structure, and a counter current just seaward of the outer edge. Freshwater-
induced density gradients account for about 80% of the flow velocity. These buoyancy-generated currents
are important unidirectional conduits for long-shore transport of suspended material of terrigenous origin
and pollutants introduced into the coastal waters by river flow.
Figure 2.3-7 shows summary information on the circulation patterns that persist in the Gulf of Honduras.
There is a persistent counter clockwise long-shore flow over the shelf with a current speed of about 0.1
0.2 m/s, best pronounced off the coast of Belize. During summer months, the buoyancy-driven counter-
clockwise coastal flow adds to the wind-driven current. During winter months, the buoyancy-driven
circulation is at a minimum and the trade winds may induce coastal upwelling off the coast of Honduras
and the associated westward long-shore flow. The open sea boundary is under the influence of a quasi-
permanent cyclonic eddy generated in the southeast corner of the Cayman basin due to interaction of the
Caribbean Current with the coast of Central America and wind.
2.3.2.2 Tides
The Cayman Sea has a microtidal range. The sea surface elevation induced by the tide is about 0.2 m
(Kjerfve, 1981). The ration of the amplitudes of the major diurnal and semidiurnal tidal harmonics,
F=(K1+O1)/(M2+S2), is about 1, so the mixed tides are mainly semidiurnal. The M2 tidal wave
propagates in the Gulf from north to south. The response of the semidiurnal components is suppressed by
about 40% relative to the expected theoretical values derived from astronomical forcing. The tidal
constituents for the Carrier Bow Cay were published by Kjerfve et al. (1982).
June 2, 2003
32
Abt Associates Inc. / Woods Hole Group
Preliminary TDA
Although the amplitude of the surface tide is small, the currents induced by the tide may be appreciable in
constrictions, reaching at times 0.4 m/s in the major reef entrances (Greer and Kjerfve, 1982).
2.3.2.3 Waves
The trade winds, blowing persistently from December to May, give rise to both wind waves and swell.
The waves are typically 1 3 m high with periods from 3 to 7 seconds (Heyman and Kjerfve, 2000).
Waves during passage of hurricanes may have a significant wave height of up to 10 m and a period of
12.7 sec (Kjerfve and Dinnel, 1983). The mean wave direction is towards 255°. The ENE sector
accounts for 87% of the frequency of occurrence of wave direction.
2.4
Ecosystems Vulnerable to Water Quality Degradation in the Gulf of Honduras
Mangroves, seagrass beds and coral reefs are among the most productive ecosystems on the planet, in
terms of average net primary productivity, and are linked to one another in biologically important ways.
The mangroves reduce the amount of sediment transferred to seagrass beds and coral reefs. At the same
time, coral reefs reduce wave energy and thereby help to establish conditions favorable for the
establishment of mangrove stands. In the coastal and marine areas of the Gulf of Honduras, these
ecosystems play a critical role in supporting the rich marine biodiversity.
Amongst the western Caribbean coastal waters, the Gulf of Honduras is marked by richness in coral,
seagrass, and mangrove habitats. Though these habitats occur elsewhere in the region, the Gulf of
Honduras is notable in the richness of these resources.
2.4.1
Mangroves/Coastal Forests
The mangroves contribute significantly to the productivity of the Gulf of Honduras. The stands act as
sediment traps in estuarine waters, thereby protecting coral reefs from sedimentation, and also serve as a
physical buffer between the inland areas and marine storms. Additionally, mangroves are an important
resource for aquatic species as they provide the main source of nutrients enriching coastal waters and
supply feeding and nursery areas for coastal fish species.
Based on in situ surveys and the analysis of available information (Yańez-Arancibia et al., 1994) four
species of mangroves are observed to be growing in the region: Rhizophora mangle (red mangrove),
Avicennia germinans (black mangrove), Laguncularia racemosa (white mangrove) and Conocarpus
erectus (button mangrove). Rhizophora mangle is the dominant species.
Satellite imagery, aerial photographs, and field studies (Yańez-Arancibia et al., 1994) revealed mangrove
distribution in the following regions: Rio Sarstoon-Livingston, Livingston-Punta de Palma, Río Dulce-El
Golfete River, Puerto Barrios and Punta de Manabique. Mangroves do not appear along the entire length
of the coast as the types of soil and topography limit their distribution, as does the small tidal range. The
majority of the coast is at an elevation well above mean sea level. The mangroves of the Sarstoon-
Temash system and the Port Honduras-Payne's Creek system form the largest mangrove stand on the
coasts of Guatemala and Belize. This area serves as critical habitat for the majority of marine species
within and beyond the gulf. In Belize there are at least 1,300 km2 of mangrove forest (Ellison), covering
3.4% of the national territory (Belize Ministry of Natural Resources, 1998). One study identified
approximately 708 hectares of mangrove forests in the Atlantic Coastal region of Guatemala. There are
92 km of mangrove growth along the shores of the Bahía de Amatique (Yańez-Arancibia et al., 1998). In
Honduras, mangroves can be found in the Jeanette Kawas National Park (House et al., 2002).
June 2, 2003
33
Abt Associates Inc. / Woods Hole Group
Preliminary TDA
Table 2.4-1. Mangrove Coverage and Protection in the Gulf of Honduras Watershed in Guatemala, 1999
Department
Mangrove Coverage (ha)
Mangroves in Protected Areas
(ha)
Jutiapa
1,115
1,114
Santa Rosa
4,910
3,543
Source: INAB, 2001
2.4.2
Seagrass Meadows
Seagrass habitats are important for fishery production, as a food source for certain threatened animal
species and for coastal stabilization. In Belize, the seagrass provides important habitat for the Conch
(Strombus gigas), which is the country's second most important commercial fish species.
As was shown by Yańez-Arancibia et al. (1994), Thalassia testudinum (turtle grass) is the predominant
species. Other species such as Halodule wrigthii and Syringodium filiform, however, may occur. In
Salvador Lagoon, there is a large bed of Vallisneria americana.
The presence and distribution of seagrass beds in any tropical region is related to the degree of water
transparency, relatively surf-free environments, shallowness and availability of sandy bottoms. In the
study area, these features are present only in some areas, such as Bahía de Amatique, in Graciosa Bay and
off the coast of Belize. In these regions, analysis of satellite imagery reveals the presence of evenly
distributed seagrass beds. The area covered by this type of vegetation is approximately 3,750.5 ha. At
places, the sea grass beds reach a density of 1,433 plants per m˛ and a biomass in dry weight of 12.48
g/m˛ (Yańez-Arancibia et al., 1994).
2.4.3
Coral Reefs
An extensive overview of the modern status of coral reefs in the region can be found in Kramer and
Kramer (2000). In Belize, the second longest barrier reef in the world (MBRS) extends for 250 km and
covers 22,800 km2 as an assemblage of lagoon patch reefs, fringing reefs, and offshore atolls. It is unique
due to its size, the vast array of reef types, the richness of the corals and its relatively pristine condition
and has been declared a World Heritage ecosystem. The outer edges of the reef are marked by deep water
corals, sponges, and soft corals, with more delicate finger and palmate corals growing above them. With
nearly 60 coral species, it is one of the most diverse coral reefs in the western Atlantic. The reef system is
closely linked to coastal wetlands, lagoons, seagrass beds and mangrove islands. This network of habitats
is able to support as many as 350 mollusk and 500 fish species.
The southern part of this reef system borders the Gulf of Honduras. The southern reefs are discontinuous
and less developed when compared to northern Belize. Large freshwater loads from the Motagua,
Sarstoon and Dulce rivers limit reef development to a few isolated corals and small patch reefs in the Gulf
of Honduras itself. Several reef islands are located near the eastern boundary of the Gulf. Results of
recent coral reef research in this area were published by USGS (2001).
Coral bleaching in response to elevated seawater temperatures was reported for much of the Caribbean
during 1983 and 1987, and the first well-documented mass bleaching event in Belize occurred in 1995
where 52% of coral colonies bleached (Kramer and Kramer, 2000). These impacts in 1995 were also
observed in Cayos Cochinos, Honduras, where 73% of scleractinian corals and 92% of hydrocorals
bleached and higher mortality was reported.
June 2, 2003
34
Abt Associates Inc. / Woods Hole Group
Preliminary TDA
2.5
Biodiversity and Protection Status in the Gulf of Honduras and its Watershed
The Gulf of Honduras region serves as habitat for some of the world's significant biodiversity, both
terrestrial and marine. The vast and varied forests that cover much of the watershed in Belize, Guatemala
and Honduras are species rich areas that provide cover for thousands of species. The Gulf of Honduras is
a highly productive region due to rivers transporting nutrients from the land, the nutrients from the open
sea, and the close proximity of the swampy mangrove areas, the seagrass beds and the coral reefs. These
factors all contrib ute to the significant biodiversity found in the region.
In its First Interim National Report to the Convention on Biological Diversity, Belize documented 571
species of birds, 162 species of mammals, 121 species of reptiles, 43 species of freshwater fish, 117
species of total inland fish, 157 mollusks, 43 species of amphibians, 288 species of Lepidoptera, 176
species of Odonata and 2 other terrestrial invertebrae. Two amphibians and one reptile species are
endemic.
According to Guatemala's National Biodiversity Strategy, throughout the country there can be found 738
bird species, 251 mammals, 112 amphibians, 214 reptiles and 651 fish species. There are 8,000 flowering
plants, 652 ferns and 1,171 endemic species of higher plants (UNEP, 1999).
The National Biodiversity Strategy and Action Plan of Honduras lists 7,524 plant species (including 134
endemic species), 744 birds (5 threatened with extinction), 231 mammals (3 endemic species and 8
threatened with extinction), 200 reptiles (27 endemic), 116 amphibians (38 endemic) and 194 species of
fish including those in the exclusive economic zone of the Atlantic.
The Gulf region's marine biodiversity is outlined in more detail below as it is of greater interest to the
current study.
2.5.1
Marine Biodive rsity
The Gulf of Honduras is rich in marine biodiversity including tropical coastal fisheries, reptiles (snakes,
turtles and crocodiles), and marine mammals (manatees). Salaverría and Rosales (1993) reported more
than 45 species of fish, mollusks and shellfish in the Bahía de Amatique, while others have identified as
many as 194 fish species in the Atlantic Ocean off the coast of Honduras (House et al., 2002). A study of
species diversity in the Punta de Manabique protected area found 100 species of fish off the coast of
Guatemala, representing 54 families (FUNDARY-ONCA). The reptiles include snakes (Boa constrictor),
American crocodile (Crocodylus acutus) (Platt and Thorbjarnarson, 2000), brown caiman (Caiman
crocodilus), loggerhead turtle (Caretta caretta), green turtle (Chelonia mydas), and leatherback turtle
(Dermochelys coriacea). The fish species that have commercial importance are mackerel, snook, calale,
jackfish, mojarra, palometa, corvina and shark.
The amount of coastal and marine species found on the Atlantic coasts of Belize and Honduras is
summarized in the tables below. Detailed information was not available for Guatemala for this study,
however.
June 2, 2003
35
Abt Associates Inc. / Woods Hole Group
Preliminary TDA
Table 2.5-1. Summary of Biological Diversity in Caribbean Coastal and Marine Areas in Belize, 1998
Taxa
Coastal
Marine
Genera
Species
Genera
Species
Fish
37
173*
229
472
Invertebrates
29
45
296**
456
Reptiles
17
124
5
7
Amphibians
6
7
-
-
Insects
152
240***
-
-
Birds
128
177
34
47
Mammals
37
39
4
5
Plants
188
235
66
315
Sub-Total
594
627
338
1,302
*
Includes freshwater species
**
Some genera and species inferred from carefully analyzed geographic distribution data
***
Including counts from rivers, forest, coastal creeks, beaches, and cayes
Source: Belize National Biodiversity Action Plan, NBC, MNREI, 1998
Table 2.5-2. Invertebrates and Urochordates in the Honduran Coastal Waters of the Caribbean
Group
Order
Genera
Species
Sponges*
17
59
23
Celenterata
12
70
103
Ctenophores
n.d.
4
4
Anelids
2
10
11
Mollusks
10
41
332
Arthropods
5
29
33
Equinoderms
4
17
24
Urochordates
n.d.
7
7
TOTAL
50
237
537
Source: Roatan Institute Marine Sciences (RiMS), 1999; Proyecto Utila, 1999; Cerrato, 1986.
*Harbour Branch Oceanographic Institution, 1998.
2.5.2
Endangered Species
A number of threatened and endangered species enjoy the rich habitat of the Gulf of Honduras. The most
notable among these are the manatee and sea turtle species. The Gulf provides food and habitat for
reproduction and growth of the Caribbean's largest population of Trichechus manatus, or West Indies
manatee, with 300 to 700 manatees in total. The West Indies manatee is an endangered marine mammal
that lives in the lagoons of the Gulf of Honduras. Manatees average 3.3 m in length and weigh between
700 and 1000 kg and move relatively slowly, making them easy targets for boats and poachers. The Gulf
of Honduras also provides reproduction and nesting sites for green, leatherback and hawksbill turtles, all
of which are endangered. The major manatee habitats and sea turtle nesting areas in the western Gulf of
Honduras are shown in Figure 2.5-1.
June 2, 2003
36
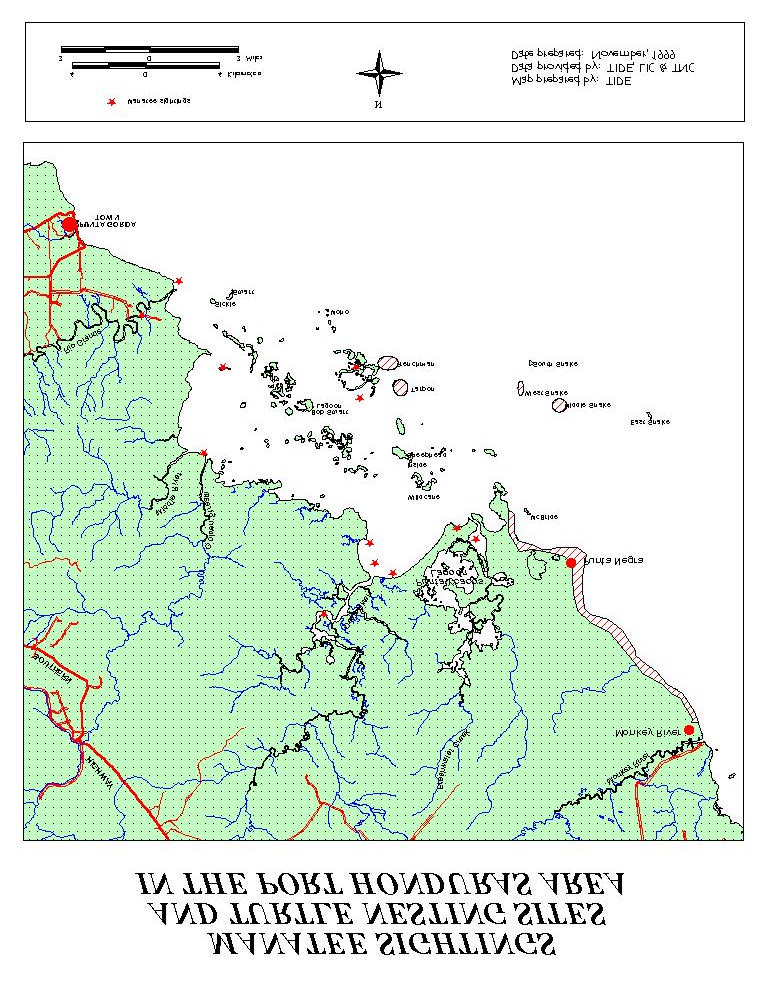
Abt Associates Inc. / Woods Hole Group
Preliminary TDA
Figure 2.5-1. Manatee Habitats and Turtle Nesting Areas in the Port Honduras Area
Source: Proacra costas, 2003
June 2, 2003
37
Abt Associates Inc. / Woods Hole Group
Preliminary TDA
The protection and enforcement status of coastal and marine species of greatest commercial and
ecological interest off the coast of Belize and Guatemala is outlined in Tables 2.5-3 and 2.5-4. As is
shown below, protection measures for the species that have some sort of protected status are either
inadequate or not adequately enforced, indicating that the species face continued threats to their survival.
Similar information on the status of species on the Atlantic coast of Honduras was not available for this
study.
Table 2.5-3. Status of Coastal and Marine Species of Primary Interest in Belize, 1998
Threatened
Threatened
Protected but
Protection
Taxa
with
And
Enforcement
Measures not
Protective Status
Unprotected
Lacking
Adequate
Hawksbill
+
+
Green Turtle
+
+
Loggerhead
+
+
American Crocodile
+
+
+
Morelets Crocodile
+
+
+
Nassau Grouper
+
+
+
Queen Conch
+
+
+
Common Snook
+
Bonefish
+
+
Jewfish
+
Tarpon
+
Permit
+
Manatee
+
+
+
Hicatee
+
+
+
Sharks
+
Marine Aquarium Fish
+
Brown Nuddy
+
+
Woodstork
+
+
Bay Breasted Warbler
+
+
Cape May Warbler
+
+
Brown Booby
+
+
Roseate Spoobill
+
+
Source: Belize National Biodiversity Action Plan, NBC, MNREI, 1998
Table 2.5-4. Status of Coastal & Marine Species of Primary Interest in Guatemala
Taxa
Threatened with
Threatened and
Protected but
Protection
Protective Status
Unprotected
Enforcement
Measures not
Lacking
Adequate
Manatee
+
+
Dolphin
+
+
Sea Turtles
+
+
Source: FUNDAECO
2.5.3
Protected Areas
In order to preserve the wealth of terrestrial and marine species in the region, Belize, Guatemala and
Belize have established a great many protected areas. Belize's system of protected areas was begun more
June 2, 2003
38
Abt Associates Inc. / Woods Hole Group
Preliminary TDA
than 75 years ago, whereas Guatemala and Honduras did not establish national parks and reserves until
more recently. In the case of Honduras, it was not until 1993.
Since the Belize Forest Department was established in 1927, 50 protected areas have been designated
nationally. These include 19 Forest Reserves, 16 National Parks, 4 Nature Reserves, 7 Wildlife
Sanctuaries, 4 Natural Monuments and 5 Private Reserves. Two World Heritage Sites and one RAMSAR
Site have been designated in the country. More than 43% of the national territory is currently under some
level of protection.
Nationally , 3,192,997 ha are included in 120 protected areas in Guatemala, which is equal to 29.3% of the
country's territory. These protected areas encompass areas of great ecological value. For example, the
Sarstoon River Game Reserve on the Belizean border of Guatemala includes critical habitats such as
mangroves and subtropical forests. The reserve provides habitat for a number of endangered species
(storks, herons, fishing eagle, toucan, jaguar, manatee, tapir, wild boar, otter and crocodile), as well as
commercially important species such as mollusks and fish (Yańez-Arancibia et al., 1998). The Rio Dulce
National Park was designated to protect tropical rainforests and manatee habitat. This area is threatened
by the destruction of coastal vegetation to build tourist infrastructure, the discharge of untreated
wastewater, agriculture and forestry activities.
In Honduras, 102 protected areas cover roughly 27% of the national territory. As of 2002, 75 of these
areas were legally established and 61 had legally established territory, equaling 2,121,326 ha, or 18% of
the country (Vreugdenhil et al, 2002). In addition to serving as a means to preserving important
biodiversity, many of the protected areas are popular tourist destinations. In the year 2000, the Jeannette
Kawas National Park in Honduras logged 3,000 visitors (Informe Nacional de Areas Protegidas de
Honduras).
Table 2.5-5 lists some of the protected areas that are located in the Gulf of Honduras and its watershed.
June 2, 2003
39
Abt Associates Inc. / Woods Hole Group
Preliminary TDA
Table 2.5-5. Protected Areas in the Gulf of Honduras Region
Belize
Guatemala
Honduras
·
Forest reserves:
·
Río Dulce National Park · Cusuco National Park
(7,200 ha)
·
Swasey Bladen (5,981 ha)
·
Jeannette Kawas
·
Río Sarstoon Special
National Park
·
Maya Mountain (51,845 ha)
Protection Area (9,600
·
Punta Izopo National
·
Columbia River (41,658 ha)
ha)
Park
·
Monkey Caye (591 ha)
·
Chocón Machacas
Protected Biotope
·
Lancetilla Botanical
·
Deep River (31,798 ha)
Garden
(6,265 ha)
·
Machaca Creek (1,520 ha)
·
Manantiales Cerro San
·
Río Blanco National Park (40
Gil Protected Reserve
ha)
(47,433 ha)
·
Sarstoon Temash National
·
Cierra Santa Cruz
Park (16,956 ha)
Special Protection Area
(46,600 ha)
·
Aguacaliente Luha Sanctuary
·
Sierra Caral Special
·
Paynes Creek National Park
(12,819 ha)
Protection Area (25,200
ha)
·
Port Honduras Marine Reserve · Punta de Manabique
·
Gladden Spit Marine Reserve
Special Protection Area
·
Sapodilla Cays Marine
(139,300)
Reserve (13,517 ha)
·
Santo Tomás de Castilla
National Park (1,000 ha)
Source: PROARCA/APM Site Descriptions Gulf of Honduras
Protected areas in the Gulf of Honduras and its watershed are exhibited on Figure 2.5-2.
Figure 2.5-2. Protected Areas in the Gulf of Honduras
(See Appendix D)
In recent years, interest has been growing in developing marine protected areas. These areas under
varying levels of protection have the goal of preserving some of the most productive and species-rich
ecosystems, which are often popular tourist destinations. The table below lists the marine protected areas
that have been designated by the Government of Belize.
June 2, 2003
40
Abt Associates Inc. / Woods Hole Group
Preliminary TDA
Table 2.5-6. Areas for Existing Marine Protected Areas in Belize
Marine Protected Area Total Area (ha)
Marine Area (ha)
Marine No-Take Area
(ha)
Corozal Bay
73,050
72,350
-
Bacalar Chico Marine 11,487
6,303
1,699 (a)
Reserve & National
Park
Hol Chan
1,638
1,545
273
Caye Caulker Marine 3,951
3,913
-
Reserve & Forest
Reserve
Half Moon Caye
3,954
3,921
3,921
Blue Hole
414
414
414
Glover's Reef
32,876
32,834
7,226
South Water Cay
47,703
46,833
-
Laughing Bird Caye
4,095
4,077
1,020 (b)
Total
179,168
179,190
14,556
(a The zones for this reserve are not yet legally established but have been implemented on an unofficial basis; b
Unofficially, a 1-mile radius around the caye is respected as a "no-take" zone)
Source: CZMAI, 1999
Additionally, proposals have been set forth for the establishment of a Belize-Guatemala -Honduras
ecological park that would encompass coastal, insular and maritime areas of the three countries.
Objectives of the park include preserving biological and genetic diversity, conserving ecosystems,
promoting sustainable use by protecting commercially viable species, promoting education and research
and promoting recreational and tourism use. Efforts to establish the tri-national ecological park have been
hindered by the territorial dispute between Guatemala and Belize, however.
June 2, 2003
41
Abt Associates Inc. / Woods Hole Group
Preliminary TDA
3.0 Socio-Economic and Development Setting
3.1
Population and Demographic Patterns in the Gulf of Honduras Watershed
The Gulf of Honduras drainage basin encompasses large sections of Belize, Guatemala and Honduras,
three culturally and resource rich countries. In Belize the Toledo and part of the Stann Creek Districts,
the country's two southern-most regions, are located within the watershed. In Guatemala, the watershed
includes all or portions of 16 of Guatemala's 22 departments, including the capital Guatemala City and
the majority of the population. The watershed in Honduras covers all or parts of 11 of the country's 18
departments.
Overall, the three littoral states have achieved varying levels of political, economic and social
development. Belize, which has reached a comparatively high level of development ranked at 58 in the
world by the 2002 UNDP Human Development Report, was under British control until only two decades
ago. Since independence, Belize has enjoyed political stability, steady development and has become a
popular tourist destination. Honduras and Guatemala are ranked much lower on the human development
index and have experienced more political upheaval and poverty. Guatemala was ravaged by civil war
for nearly four decades that did not end until a 1996 peace accord was signed. Turmoil in Nicaragua and
El Salvador has spilled over into Honduras in recent decades, hindering development and causing great
movements in population. Natural disasters, such as Hurricane Mitch which blasted the region in 1998,
have further impeded development in the Gulf of Honduras littoral countries.
Table 3.1-1 indicates the relative world development rankings of the three Gulf of Honduras countries and
important national development statistics.
Table 3.1-1. Human Development Indicators
Country
2002 HDI
World Rank
GDP per Capita
Life Expectancy
Belize
0.784
58
5,606
74.0
Guatemala
0.631
120
3,821
64.8
Honduras
0.638
116
2,453
65.7
Source: Elaboracion propia con base en PNUD, 2002
(from UNDP Informe Sobre Desarrollo Humano Honduras 2002)
Despite the overall disparities in development among the three countries, the populations located within
the geographic region of the Gulf of Honduras watershed experience many similar circumstances. The
watershed is predominately rural, ethnically diverse with a large percentage of indigenous peoples, and
agrarian-focused.
Another characteristic of the rural areas in the watershed is limited access to basic services such as
education, healthcare, water and electricity. The Toledo District of Belize has been determined to be the
most indigent region in the country, largely due to the lack of basic social services. Roughly 80% of the
communities in southern Belize do not have even a rudimentary water system (IADB, 2000). A report
prepared for the IADB listed health threats due to inadequate access to potable water and sanitation as one
of the greatest threats to regional development on the north coast of Honduras (Niklitschek et al., 2002).
The watershed is also home to many indigenous populations, including Q'ekchi Maya, Mopan, Culies,
Garifuna, Creole and Mestizo. In general, particularly in Guatemala where indigenous rights are not as
developed, the indigenous populations are less likely to have achieved higher education and more likely
to have a lower standard of living than non-indigenous populations.
June 2, 2003
42
Abt Associates Inc. / Woods Hole Group
Preliminary TDA
3.1.1 Current Population and Population Growth Rates
The total population of the administrative districts that are located in total or in part in the Gulf of
Honduras watershed is 12.4 million. Approximately 2 million of these live in the large urban centers of
Guatemala City, Guatemala and San Pedro Sula, Honduras. Large portions of the watershed population,
however, are rural. Population size by administrative district in the Gulf of Honduras watershed is shown
in Figure 3.1-1. National population figures and population growth rates are listed in Table 3.1-3.
Figure 3.1-1. Populati on in the Gulf of Honduras Watershed by Administrative District
(See Appendix D)
Table 3.1-2. National Population and Population Growth Rates in the Gulf of Honduras Countries
Country
Population (2000)
Annual Pop.
Annual Pop.
Population (2015)
millions
Growth Rate
Growth Rate
millions
(1975-2000)
(2000-2015)
Belize
0.2
2.1
1.6
0.3
Guatemala
11.4
2.6
2.4
16.3
Honduras
6.4
3.0
2.0
8.7
Source: UNDP 2002 Human Development Report
Several smaller population centers are located in the Gulf of Honduras coastal zone, which directly affects
the coastal and marine ecosystems. Roughly half a million people live along the coast of the Gulf of
Honduras. Nonetheless, as is shown in Figure 3.1-2, population density in the coastal zone is very low.
Figure 3.1-2. Population Density in the Coastal Zone of the Gulf of Honduras Watershed
(See Appendix D)
Two sparsely populated administrative districts are included in the Gulf of Honduras watershed in Belize:
Toledo and Stann Creek. In 2000, fewer than 50,000 persons were registered in these two districts.
Urbanization in these districts is low and is actually decreasing due to agriculture serving as the dominant
economic activity in the area. The population density of Southern Belize is currently the lowest in the
country, at 21 persons per square mile in the Stann Creek District and 11 persons per square mile in the
Toledo District (IADB, 2000) (See Table 3.1-3). While the population remains low, population growth is
high in the region. In only the last 20 years, the population in the Toledo and Stann Creek Districts has
doubled. Migration is another factor affecting the population in Southern Belize as unskilled workers
move into the area from Honduras and Guatemala. Migration into the area is often spurred by economic
problems or natural disasters in nearby countries, such as Hurricane Mitch (IADB, 2000).
Table 3.1-3. Population Density in the Southern Region of Belize by District, 1970-1998
Density per square kilometer
District
Area
(sq. km)
1970
1980
1991
1998
Stann Creek
2,554
5.10
5.55
7.19
9.38
Toledo
4,413
2.04
2.67
4.16
5.13
Source: Belize CSO
According to the 2002 census, roughly 7.8 million people live in the Guatemalan section of the Gulf of
Honduras watershed. Included in the watershed is the capital of Guatemala, Guatemala City, with a
population of nearly 1.5 million people. Santo Tomás de Castilla, Livingston and Puerto Barrios are the
largest population centers on the Atlantic coast of Guatemala.
June 2, 2003
43
Abt Associates Inc. / Woods Hole Group
Preliminary TDA
The 2001 census found the popula tion in the Honduras section of the Gulf of Honduras watershed to be
4,547,491 and that the rate of urbanization was fairly high. In the two major river basins in this area, the
population density is also relatively high. While the Ulúa basin covers 19% of the country, it is home to
33% of the population, reaching a density of 49 inhabitants/km2. Approximately 71% of the population is
urban. The Chamelecón basin covers only 4% of the country but has 19% of the population with a
density of 137 inhabitants/km2 (CIAT). The population centers on the coast include Puerto Cortés with a
population of 51,000, San Pedro Sula with a population of 350,000, Tela with 25,000 and La Ceiba with
80,000.
3.1.2
Literacy Rates
Access to education varies greatly between the rural and urban areas in the watershed. The poor are much
less likely to have educational opportunities than are the non-poor. Additionally, particularly in
Guatemala, girls are less likely to receive higher education than are boys (World Bank, 2003).
While overall education rates in Belize are high for the Central American region, the southern area of the
country has an unusually low average level of education. In the Toledo District of Belize access to
education is very limited and there are only a few primary schools, which is inadequate for the size of the
population. For example, there is only one secondary school in Punta Gorda (DHV Consultants, 1994).
In 2000, only 6.4% of the population of the district had reached a secondary level of education (Belize
Central Statistical Office, 2000).
Guatemala has one of the lowest schooling averages in Latin America, second only to Haiti, and
education funding has traditionally been among the lowest in the region at only 1.7% of GDP, compared
to 3.6% in Honduras (UNDP, 2002). Table 3.1-4 provides information on national literacy rates in the
Gulf of Honduras countries, along with statistics on public expenditure on education.
Table 3.1-5. Literacy rates and education spending in the Gulf of Honduras countries
Country
Adult Literacy
Public Education
Public education expenditure
Rate (2000)
Expenditure (% of
(% of total govt. expenditure)
GDP) 1995-97
1995-97
Belize
93.2
5.0
19.5
Guatemala
68.6
1.7
15.8
Honduras
74.6
3.6
16.5
Source: UNDP 2002 Human Development Report
3.1.3
Access to Healthcare
Similar to education, access to healthcare in the Gulf of Honduras watershed differs greatly between rural
and urban areas. While many urban areas now have improved health services, those living in more
sparsely populated, and largely indigenous, areas have much less access to even basic healthcare. The
problems with the lack of healthcare are exacerbated by the lack of potable water supplies and sanitation
and the poverty that often results in malnutrition. As a result, infant mortality rates remain high in many
of the more rural areas and illnesses such as cholera and diarrhea are common.
Healthcare services in the Toledo and Stann Creek Districts of Belize remain basic despite improvements
in other areas of the country (DHV Consultants, 1994). In 2000, there were only six health centers
located in the Toledo District and 9 in Stann Creek (Belize Central Statistical Office, 2001). The Toledo
District also has some of the highest numbers of infectious diseases in the country. In 1999, more than
1,000 cases of malaria and 12 cases of cholera were counted (Belize Central Statistical Office, 2000).
June 2, 2003
44
Abt Associates Inc. / Woods Hole Group
Preliminary TDA
In Guatemala, approximately 54% of the country's population has access to healthcare, but the major ity
of doctors are located in the vicinity of Guatemala City. Those living in rural areas have much less access
to healthcare than the national average. The country's infant mortality rate is high and about 60% of
young people suffer from malnutrition (UNEP, 1999). According to a recent World Bank report,
Guatemala ranks last in Latin America and the Caribbean for life expectancy, infant mortality and
maternal mortality (2003).
Those living in urban areas in Honduras have greater access to healthcare than do those in rural areas.
For example, Puerto Cortés has a regional hospital as well as private clinics. The infant mortality rate for
the city is 29 per 1,000 live births, lower than the national average of 32 (Banco Interamericano de
Desarrollo, 1997).
Those living in the coastal zone of Guatemala and Honduras have increased health problems compared to
the average in the countries. Coastal residents have higher rates of mortality and morbidity caused by
infectious diseases, parasites, nutritional deficiencies, and a lack of access to basic services such as
potable drinking water, sewage and adequate healthcare services (OAS, 1998).
Table 3.1-5 provides basic national healthcare statistics for the Gulf of Honduras countries.
Table 3.1-5. Healthcare Statistics in the Gulf of Honduras Countries
Country
Infant Mortality
Physicians (per 100,000
Health expenditure per
Rates (2000)
people) 1990-99
capita (PPP US$) 1998
Belize
34
55
82
Guatemala
44
93
78
Honduras
32
83
74
Source: UNDP 2002 Human Development Report
3.2
Regional Economic Characteristics
3.2.1
Structure of Economic Output in the Watershed
The economies in the region are largely agriculturally based, with bananas, coffee and sugar being the
lead export products. Guatemala is also the world's leading exporter of cardamom. Recently, however,
light manufacturing of clothing and textiles has increased in Guatemala and Honduras. Other
manufacturing done in the watershed is food processing, chemicals and paper. Tourism in the watershed
is also one of the fastest growing sectors.
Poverty in the watershed is high, particularly in the rural regions. While 33% of Belize's population is
below the poverty level, 43% of those in rural areas are poor (Belize Ministry of Natural Resources,
Environment, and Industry, 2002) and a disproportionate amount of these are located in the Toledo
District.
A very high percentage of all Guatemalans live below the poverty level even though the country has the
largest economy in Central America. Guatemala has the third highest degree of inequality among low- to
middle-income countries in the world and the indigenous population is much more vulnerable to poverty
than the non-indigenous. 44% of the children in Guatemala under the age of five are stunted due to
malnutrition. More than 81% of the poor and as high as 93% of the extreme poor in Guatemala live in
rural areas (World Bank, 2003).
June 2, 2003
45
Abt Associates Inc. / Woods Hole Group
Preliminary TDA
Honduras is ranked as one of the lowest-income countries in the Western Hemisphere. Even though the
poverty rate in Honduras decreased by 10% during the 1990s, in 1999 nearly 75% of the country's rural
population was still considered poor (World Bank Honduras Poverty Diagnostic, 2001). While the
economies of Guatemala and Honduras had been improving in recent years, Hurricane Mitch in 1998 had
a devastating effect on economic output in the region
3.2.2 Future Trends in Economic Output in the Watershed for the Next 10 Years
Economic development is projected to continue to increase in the region in the future. Because the
countries are so heavily dependent on natural resources, however, their ability to protect the environment
will affect their prospects for development of the agriculture, fishing and tourist industries.
One of the most distinguishing trends in the region's economy is the strengthening role of tourism, led by
Belize. While most tourists have traditionally visited areas outside the boundary of this project study
area, such as the northern areas of Belize in the vicinity of the coral reefs and the bay islands of Honduras,
tourism is now spreading into other areas. As southern Belize is made more accessible via roads,
additional hotels are being built to attract visitors. Areas on the Atlantic Coast of Guatemala are
becoming tourist destinations, and cities such as Puerto Cortés in Honduras are building hotels. A 1998
sustainable development plan for the coastal zone of Guatemala and Honduras focused on tourism
development as its centerpiece, highlighting its future potential (OAS).
Another trend that seems to be emerging in the region, particularly in Guatemala and Honduras, is
increasing industry. In the near future Guatemala's production of crude oil, used mainly for asphalt and
other derivatives, is expected to continue to increase. Additionally, the clothing and textile industries
emerging in the area appear to be growing. The sustainable development plan for the Atlantic Coast of
Guatemala and Honduras encourages the development of food processing industries in the region (OAS,
1998).
At the same time, the overall role of agriculture in the countries' economies will likely continue to
diminish. The coffee market has contracted due to a structural terms-of-trade decline, and while other
non-traditional products have been grown in its place, they have not offset the income and employment
lost as a result of the coffee crisis (World Bank, 2003). Over the last three decades, the importance of
agriculture to Honduras's national economy has been diminished significantly, while the role of industry
has steadily increased (Cotty et al., 2002). Between 1990 and 2001, agriculture, forestry, livestock and
fisheries fell from 25.9% of the GDP to 22.6% (UNDP, 2002). Nonetheless, the agricultural sector will
continue to be the largest employer in the region for the foreseeable future due to its labor intensive nature
and the high percentage of the population engaged in subsistence farming.
Forecasters predict an increasing need for maritime transport in the future as globalization continues.
Larger numbers of tourists will bring in additional cruise ships. The increased oil production in
Guatemala will necessitate more maritime transport. A proposal has been developed to build a large
power plant in the vicinity of Puerto Cortés that would be fueled by liquid natural gas (AES Honduras,
2001). The LNG would be brought in by tanker through the Puerto Cortés navigation channel and
offloaded at the Texaco installation. This has the potential to increase shipping of hazardous materials
into the Gulf of Honduras. And as the economies in the region continue to grow there will be even
greater exchange of goods between the region and its trade partners. The signing of the trade agreement
between Central America and the United States will likely result in increased shipping in the region,
although no conclusive studies of the impacts of the trade agreement have yet been completed.
June 2, 2003
46
Abt Associates Inc. / Woods Hole Group
Preliminary TDA
3.3
Industries Impacting and Impacted by the Gulf of Honduras
The economic activities taking place in the Gulf of Honduras and its watershed both depend upon and
affect the Gulf of Honduras region environment. Agriculture, aquaculture, fisheries and tourism require
clean water and other natural resources. At the same time, these industries have the potential to
negatively affect the region's environment through dispersal of harmful chemicals, the use of destructive
fishing methods and sedimentation of waterways. In Sections 3.3.1-3.3.6 below the major industries in
the region are discussed in terms of their current status and role in the regional economy. In section 5.3,
each of these industries is discussed in greater detail in terms of its effects on the marine and coastal
environment in the Gulf of Honduras.
3.3.1
Agriculture
Despite its declining economic influence, agriculture remains the dominant economic activity in the Gulf
of Honduras watershed. It also continues to be the largest sector of employment for the region's
population. For example, more than 30% of southern Belize's labor force, or 5,000 people, is engaged in
the activity. At the same time, the average wage provided by agriculture is significantly lower than that
of other industries such as tourism (IADB, 2000).
Agriculture takes place at both the subsistence and the commercial levels in the watershed. The small-
scale farming methods used in the region are very labor intensive and primarily non-mechanized, but are
productive. Other crops that are cultivated for export, such as bananas, are grown on larger plantations.
Bananas are an important export product for all three Gulf of Honduras countries. Additionally, coffee is
a major product of Guatemala and Honduras. Other crops grown in the region include cardamom, sugar,
citrus fruits, rice, cacao, beans and corn. Subsistence farming focuses on basic crops such as corn, beans
and maicillo. Rubber plantations are also present in the region and the farming of African palm is
expanding. Export is currently primarily limited to coffee, cacao and banana, however.
3.3.2
Commercial and Artisanal Fisheries
The Gulf of Honduras sustains a number of commercially-exploited species including, populations of
shrimp, lobster, conch and scale fish (swordfish, jurel, sea bass, barracuda, tuna, pejerrey and anchovy)
and there is an active fishing popula tion in each of the Gulf countries. Additionally, flyfishing has
become a popular tourist activity in the region. Species caught include shad, pompano and sea bass. One
study indicates that in the entire Gulf of Honduras region landings reach approximately 14,300,000
pounds of fish annually, valued at approximately US$ 11,400,000 (Heyman et al., 2002).
The waters off of southern Belize are potentially the richest in the country, including the best shrimping
grounds, which are found in the far south near the mouths of the Moho, Temash and Sarstoon Rivers.
Belize has both an artisanal shrimp fishery and industrial trawl fishery. The artisanal shrimp fishery uses
only small skiffs and canoes and consists of about 200 fishermen (Gladden Spit Marine Reserve), whereas
the industrial fishery consists of large fleets. In 2001, 10 trawlers were operating in the southern waters
of Belize and produced more than 150,000 lbs. of shrimp for both local consumption and export (Belize
Fisheries Department, 2001). In addition to catching fish in the region, fishermen dive for conch and
lobster. Even though the lobster catch has been in decline in recent years, it remains one of Belize's most
valuable seafood exports. The value of the Belizean fishery in the Gulf of Honduras is estimated to be
about US$ 1 million, or 8% of the total Gulf catch (Heyman et al., 2002).
June 2, 2003
47
Abt Associates Inc. / Woods Hole Group
Preliminary TDA
On the Atlantic Coast of Guatemala, fishing is primarily carried out by unskilled fishermen in Graciosa
Bay, near Punta Manabique, in the mouth of the Sarstoon River, near Livingston and in the Río Dulce-
Golfete region (UNEP, 1995). Guatemala has 1,415 active fishermen (Gladden Spit Marine Reserve).
Commercially valuable species include mackerel, snook, calale, jackfish, mojarra, palometa, corvina and
shark. Shrimp, lobster and tarpon are also exploited in the region. Little information is available,
however, on the current state of fisheries, including the volume of fish catch and in terms of their biology.
This lack of knowledge potentially could le ad to problems of overexploitation.
Honduras has 647 active fishermen (Gladden Spit Marine Reserve). According to the FAO, nationwide
Honduras is one of the largest fisheries producers in terms of value in Latin America and the Caribbean
with 8.3% of the region's fisheries value (1996). Similar to Guatemala, however, studies are lacking on
the current status of fisheries.
3.3.3
Aquaculture
Aquaculture is a major economic activity in the coastal region of southern Belize. In Honduras
aquaculture is limited to the Gulf of Fonseca on the Pacific coast. The predominant fishing and
aquaculture products in the region are Panulirus sp. Lobster and prawn. The primary shrimp species
grown in Belize is Penaeus vannamei, or white farm shrimp. Several shrimp farms are located in the Gulf
of Honduras watershed, including one in the vicinity of the port of Big Creek (CZMAI, State of the Coast
Report 1999). The shrimp farms are sited in coastal areas in order to use the seawater to grow the shrimp,
and so far the fisheries have used the existing mangroves to filter the seawater instead of destroying them
(DHV Consultants, 1994). The major shrimp farms in southern Belize are listed in Table 3.3-1.
June 2, 2003
48
Abt Associates Inc. / Woods Hole Group
Preliminary TDA
Table 3.3-1. Status of Active Shrimp Farms in the Southern Region of Belize, 1999
Size of
Area under
Number
Production
Company
Location
Property
Production
of Ponds
(lbs.)
(acres)
(acres)
Nr Indian Hill Lagoon,
Nova Toledo
Toledo District
9,450
411
27
554,440
Nr Placencia Lagoon,
Nova Laguna Madre
2,297
48
12
1,037,661
Stann Creek District
Blair Atoll, Placencia
Belize Aquaculture, Ltd.
Lagoon, Stann Creek
11,000
91
36
432,565
District
Nr Monkey River
Toledo Fish Farm
Village, Toledo District
n/a
172
32
n/a
Source: Shrimp farm companies and Belize Fisheries Department
3.3.4
Tourism
As the second largest foreign exchange earner, tourism is an important industry for the Gulf of Honduras
countries. It is also a major focus of regional development activities in the watershed. While traditional
tourism continues to be popular, ecotourism has been increasing in the region in recent years.
Although tourism is the second highest foreign exchange earner in Belize, it historically has been limited
to the regions north of the Gulf of Honduras watershed (DHV Consultants, 1994). In 2001, only 2.2% of
Belize's total tourists were destined for the Toledo District and only 8.9% for Stann Creek (Belize
Tourism Board, 2001). Tourism infrastructure in the southern region of Belize has increased dramatically
in recent years, however. Between 1988 and 2001, the number of hotels in Stann Creek grew from 14 to
41, and from 10 to 36 in the Toledo District (Belize Tourism Board, 2001). Occupancy rates for Stann
Creek (not including Placencia where occupancy rates are higher) averaged only 21% in the late 1990s,
however, while those for Toledo averaged 10%. Whereas the region accounted for the 23% of the
nation's hotels and 14% of rooms and beds, it accounted for only 6% of tourism income derived from
accommodation (IADB, 2000).
Tourists in Belize are attracted primarily to the coral reefs, cayes, and islands located in the northern
section of the country. The tourism product in the southern part of the country consists mainly of eco-
cultural type activities, including two main archaeological sites and several protected areas, as well as
some beach and marine adventure activities.
Tourism is the second largest foreign exchange earner for Guatemala after coffee. The Atlantic Coast,
however, has only limited tourism infrastructure and services. Some hotels with basic services can be
found in Puerto Barrios, Santo Tomás de Castilla, Livingston and Golfete. Ecotourism is growing as an
economic activity in the region, though. Punta de Manabique now has the infrastructure required for
tourism and ecotourism is being promoted as an economic alternative for area communities. Hiking,
camping, kayaking and bird watching packages are being sold for the area and interpretative trails have
been built.
June 2, 2003
49
Abt Associates Inc. / Woods Hole Group
Preliminary TDA
To further promote the industry in the country, the Guatemalan Institute of Tourism (INGUAT) designed
a plan of action known as the National Plan for Developing Sustainable Tourism. Recognizing that the
tourism potential of the Atlantic Coast needed to be exploited in a manner that did not harm the area's
sensitive ecosystems, the INGUAT worked with the Caribbean Environment Programme (CEP) of the
United Nations Environment Programme to prepare the "Integral Plan for Management of the Marine
Zone of the Atlantic Coast of Guatemala."
Nationally, tourism is the second largest foreign exchange earner for Honduras (Vreugdenhil et al., 2002).
While tourism traditionally has not been a major industry in the northern region of Honduras, it is
currently growing, particularly on the bay islands. In 2001, the World Bank approved a US $5 million,
interest-free credit to promote sustainable tourism along Honduras's North Coast and offshore Bay
Islands, including the communities of Omoa, Tela and La Ceiba. Omoa and Cortés have 10 hotels with
80 rooms and 121 beds (Inventario de establecimientos turísticos, 2001). The city of San Pedro Sula also
has adequate infrastructure to support tourism in the region. Puerto Cortés has 15 hotels with 277 rooms
and 438 beds. Approximately 16,000 tourists arrive in Puerto Cortés via cruise ship annually (Dirección
General de Población y Política Migratoria). There is significant uncertainty regarding tourism visitation
levels in non-island destinations in northern Honduras, however. In 1999 it was estimated that the Bay
Islands had 41,000 visitors and 36,000 tourists visited the remainder of the North Coast (Pratt, 2002).
Strategic planning of tourism in Honduras has been guided by the two following important policy
documents: El Plan del Desarrollo Turístic o Sostenible de Honduras 1998-2002 and Turismo en
Honduras: El Reto de la Competitividad.
3.3.5
Marine Transport
Marine transport plays a critical role in the region's economy. The major port facilities on the Gulf of
Honduras are Puerto Cortés in Honduras, Puerto Barrios and Puerto Santo Tomás de Castilla in Bahía de
Amatique in Guatemala, and Big Creek and Belize City Port in Belize. Although the Belize City Port is
located to the north of the TDA study boundary, its port and maritime activities are considered in this
study because a spill or grounding in the vicinity of the Belize City Port could negatively affect the Gulf
of Honduras environment due to the prevailing oceanographic currents.
These ports include infrastructure for loading, unloading, storage and transport of hydrocarbons, bulk
liquids and dangerous chemicals as well as containerized cargo and bulk goods. Puerto Cortés is Central
America's only deep water port and one of the best equipped in the region. Annually it accommodates
more than 1700 vessels with a diverse cargo handling both liquid, including refined oil products, and
bulk. Puerto Santo Tomás de Castilla receives more than 1200 ships annually, including 160 oil tankers.
Tankers also use Puerto Barrios to transport large volumes of hydrocarbon and chemical products.
Although Big Creek is currently limited to banana export, future plans could include additional products.
Belize City Port handles a wide variety of cargo of both liquid and bulk, but the majority of the cargo is
now containerized. In 2001, the five major ports in the Gulf of Honduras region accommodated nearly
4,000 ships and handled more than 12 million metric tons of cargo. Details on the ships and volumes of
goods accommodated by the five ports between 1996 and 2002 is listed in Tables 3.3-2 and 3.3-3 below.
June 2, 2003
50
Abt Associates Inc. / Woods Hole Group
Preliminary TDA
Table 3.3-2. Cargo Imported/Exported Through Ports Annually (Metric Tons)
1996
1997
1998
1999
2000
2001
2002
Belize City
Port
449,378*
487,099*
504,450*
578,407*
610,505*
704,837*
n/a
Big Creek
65,868*
57,774*
57,683*
64,157*
134,621*
90,232*
n/a
Santo Tomás
de Castilla
3,185,949
3,775,375
4,437,009
4,255,514 4,349,697 4,245,118 4,800,027
Puerto Barrios
1,152,000**
1,299,000**
1,537,000**
1,705,000** n/a
1,679,700
1,353,113
Puerto Cortés
3,992,700
4,677,800
5,091,100
4,977,360 5,398,290 5,661,940
n/a
* Port of Belize Prospectus 2002
** SIECA 2001
EMPORNAC 2002
Puerto Cortés
Table 3.3-3. Port Ship Calls in the Gulf of Honduras
1996
1997
1998
1999
2000
2001
Belize City Port
231
221*
210*
252*
223*
196*
Big Creek
54*
56*
58*
58*
105*
77*
Santo Tomás de
Castilla
1244**
1,263
Puerto Barrios
462**
376**
468**
583**
535
Puerto Cortés
1,325
1,558
1,694
1,951
1,790
1,786
* Port of Belize Prospectus 2002. Figures for 2001 are only through September.
** ECAT, SIECA 2001
EMPORNAC 2002
Puerto Cortés
Shipping has served as a major means of transport of goods into and out of the Gulf of Honduras and the
volume of goods shipped is expected to continue to increase. As population growth and increasing
globalization cause the expansion of trade in the region, the importance of shipping will only continue to
grow. From 1990-1999, the volume of goods handled at Puerto Santo Tomás de Castilla, Puerto Barrios
and Puerto Cortés annually increased an average of 11.09% (1991-1998), 16.50% and 8.52%, respectively
(SIECA, 2001). In 2001, Puerto Cortés almost reached the limits of its capacity. Santo Tomás de Castilla
and Puerto Barrios are projected to reach the limits of their capacity in 2003-2004 (SIECA, 2001).
The shipping of hazardous cargo in the region is also expected to increase. Accelerated growth in the
traffic and handling of hydrocarbons is projected in the next decade as a result of increasing crude oil
production in Guatemala, expanding hydrocarbon exploration, and an increased energy demand in the
region. This is being accompanied by several projects for the expansion or construction of new port
facilities at all five ports. Transport of hazardous cargo is discussed in more detail in Section 5.1 and
details on the types of and amounts of hazardous cargo transported through the ports is included in
Appendix C.
3.3.6
Industry
Manufacturing in the region remains underdeveloped, particularly in Belize. In the southern region of
Belize, the only major industries are two citrus processing plants and one rice processing factory (DHV
Consultants, 1994).
June 2, 2003
51
Abt Associates Inc. / Woods Hole Group
Preliminary TDA
Although industry remains a comparatively small percentage of Guatemala's national economy, the
majority of manufacturing takes place in the Gulf of Honduras watershed. Guatemala City serves as the
industrial center of the country. Efforts are underway to increase the oil and food processing industries in
the watershed.
Two of Honduras's main industrial areas are located in the Gulf of Honduras watershed: San Pedro Sula
and Puerto Cortés. Forty-six percent of Honduras's industry is located in Cortés province, on the Gulf of
Honduras. Nationally, cement, cotton and sugar are produced for export. Textiles, detergents, light
metals, chemicals and food products are also manufactured there, but mainly for domestic consumption.
June 2, 2003
52
Abt Associates Inc. / Woods Hole Group
Preliminary TDA
4.0 Overview of Applicable Institutional and Regulatory Frameworks
4.1
International Conventions
Port operation generally falls into the categories of cargo handling, passenger terminals, fishing,
recreation, and tourism activities. The execution of these activities requires a variety of maintenance
activities such as dredge and fill operations, construction, and disposal of solid and hazardous wastes.
These ongoing maintenance activities can cause environmental damage if not carried out in accordance
with internationally recognized best practices. Standardization of port operation and navigational safety
have been enforced through international conventions and national laws.
For international conventions to be effective, it is necessary for them to be accepted and implemented by
a majority of the shipping community and port systems. When conventions are not put into practice by
their signatories, the result is a confusing set of requirements and expectations for the shipping industry as
well as an unlevel playing field for those who choose to invest in the training and equipment necessary to
comply with the standards.
Once a government makes the formal commitment to become signatory of a convention, it assumes the
obligation to enforce the measures required by the convention. In most cases, this implies the enactment
of a national law, establishment of standards, and sometimes institutional reorganization. These changes
require the government to work closely with and provide adequate notice to the shipping industry, port
authority, and other stakeholders so they may make the investments necessary to comply with new
requirements. Relevant international conventions for the GEF Project include:
· United Nations Convention on the Law of the Sea (UNCLOS, 1982) - Broad-based convention
addressing diverse aspects of protection and preservation of the oceans including investigation and
control of contamination from land-based operations and ships.
· International Convention for the Prevention of Pollution from Ships (MARPOL 73/78) -
Convention addressing contamination from ships including waste, oil, air emissions and other hazardous
substances.
· London Convention on the Prevention of Maritime Pollution by Dumping of Waste and other
Matters (LDC, 1972) - Prohibits the dumping of certain hazardous materials, requires a prior special or
general permit for other wastes.
· COLREG - Updates and replaces the Collision Regulations of 1960 that were adopted at the same time
as the 1960 SOLAS Convention. Rule 10 provides guidance to determining safe speed, the risk of
collision and the conduct of vessels operating in traffic zones.
· Safety of Life At Sea (SOLAS, 1960) - Specifies minimum standards for the construction, equipment
and operation of ships. Flag States are responsible for ensuring that ships under their flag comply with its
requirements.
· CLC 69 - Civil Liability Convention financially covers those who suffer oil pollution damage resulting
from maritime accidents involving oil-carrying ships. Places the liability for damage on the owner of the
ship from which the oil escaped or was discharged.
· FUND 71 - Establishes a Fund for providing compensation for oil pollution incidents beyond that
provided for by the CLC Convention.
June 2, 2003
53
Abt Associates Inc. / Woods Hole Group
Preliminary TDA
· Cartagena Treaty 1983 - Provides for the protection and management of the environment and coastal
areas of the Caribbean Region, its protocol (1986) provides for cooperation to respond to oil spills.
· International Maritime Dangerous Goods Code (IMDC, 1990) - The IMDG Code is intended to
prevent marine pollution through safe shipping of hazardous materials. The IMDC is based on the United
Nations "Recommendations on the Transport of Dangerous Goods", but also includes additional
requirements applicable to the transport of hazardous materials by sea.
· Load Lines 66 - Establishes limitations on the draught to which a ship may be loaded. Limits are given
in the form of freeboards, which constitute external weathertight and watertight integrity.
·
Table 4.1-1. Figure Relevant International Conventions Related to Maritime Administration
ments 93
ntion 79
ention 69
OPRC/HNS 2000
IMO Convention 48
IMO amendments 91
IMO amend
SOLAS Convention 74
SOLAS Protocol 78
SOLAS Protocol 88
Stockholm Agreement 96
LOAD LINES Convention 66
LOAD LINES Protocol 88
TONNAGE Convention 69
COLREG Convention 72
CSC Convention 72
SFV Protocol 93
STCW Convention 78
SAR Conve
INMARSAT Convention 76
MARPOL 73/78 (Annex I/II)
MARPOL 73/78 (Annex III)
MARPOL 73/78 (Annex IV)
MARPOL 73/78 (Annex V)
MARPOL Protocol 97 (Annex VI)
London Convention 72
London Convention Protocol 96
INTERVENTION Convention 69
CLC Conv
CLC Protocol 76
CLC Protocol 92
FUND Convention 71
FUND Protocol 76
FUND Protocol 92
OPRC Convention 90
HNS Convention 96
Bunkers Convention 01
Anti Fouling 01
x x x x
x x x
x
x x x x
x x x
x
Belize
x x x x x x
x
x
x x x x x
x
Guatemala
x x x x x
x x x x x
x
x x
x
Honduras
Source: The strategic role of Hydrography in the proposed GEF project Environmental Protection and Maritime
Transport Pollution Control in the Gulf of Honduras prepared by Meso-American Caribbean Hydrographic
Commission
In addition to being signatories to international conventions, Honduras, Guatemala, and Belize have also
promulgated national legislation. While a general framework exists to support program activities to
address marine contamination and navigational security, implementation has been inconsistent as laws
and international conventions remain without supporting regulations and adequate institutional support at
the national level. In the case of Guatemala, the situation is more confusing, because the country does not
have a viable Port Authority. This may be changing in the near future as the World Bank is extending
technical assistance to the government of Guatemala for the purpose of creating a National Port
Authority.
The operation of the national port system varies among the three countries and even within countries there
are issues with fragmentation of responsibilities among the national regulatory agencies and local
government. A detailed study carried out by ECAT in 2001 (ECAT, 2001) determined that the majority
of Central American countries have not given maritime issues the necessary emphasis. Greater priority
has been dedicated to terrestrial transport and telecommunications because they are more visible activities
with greater impact on the daily lives of the public. Global problems that have been identified throughout
Central America maritime administration include:
June 2, 2003
54
Abt Associates Inc. / Woods Hole Group
Preliminary TDA
· Lack of stakeholder participation in the development of international norms
· Need for better trained personnel
· Few academic or educational institutions that offer specialized professional development
· Inadequate financial resources for personnel and equipment
·
· Need to strengthen the legislative framework and national policies governing maritime issues
4.2
Maritime Administration
Both Honduras and Belize have national port authorities responsible for compliance with marine pollution
control, port operations, and concessions. Guatemala does not have a viable national port authority and
responsibilities are shared among several institutions. Additionally, each country has other ministries
responsible for coastal planning, compliance with international conventions, environmental monitoring,
sanitation, and environmental impact assessment. These agencies with the national maritime authorities
form a comprehensive network of regulatory programs. The institutional and regulatory framework for
the three countries are characterized by certain institutional successes, but are generally impeded by
fragmentation of responsibilities and deficiencies in program coverage.
This section provides an overview of the primary institutions involved in the planning and operational
aspects of marine pollution control, port administration, and navigational safety.
4.2.1
Belize
Belize is a constitutional monarchy with a parliamentary form of government based on the British model.
The British monarch is the titular head of state and is represented in Belize by a governor general. The
governor general has a largely ceremonial role and is expected to be politically neutral.
The national government is responsible for national policy and planning; development of technical norms,
standards and procedures; and inter-sectoral coordination. The district government is responsible for
local level implementation, inter-sectoral collaboration at the district and community level, and
community participation. Management and coordination of all ministries and departments are controlled
from ministry headquarters, although some maintain offices in the smaller cities. The highly centralized
government has had limited effectiveness targeting and addressing regional and local needs.
The Belize Ports Authority is administered by a Board consisting of a Chairman and eight members that
are appointed for renewable terms of two years. The Authority is responsible for all aspects of port
operation, shipping, and navigation control. The maritime administration for Belize is shown in Figure
4.2-1.
Big Creek Port forms part of the proposed GEF project. It is operated by the Banana Growers
Association and Banana Enterprises Limited. Pesticide monitoring has been conducted by inspectors
from the National Environmental Authority. Environmental problems that have been identified at Big
Creek include lack of wastewater treatment and improper application and disposal of pesticides by the
banana growers industry.
Belize possesses a Draft National Oil Spill Plan, but there is no infrastructure or resources for its
implementation. In the event of an oil spill, the ports would be primarily dependent on the petroleum
industry for response capability.
Figure 4.2-1. Maritime Administration for Belize (next page)
June 2, 2003
55
Abt Associates Inc. / Woods Hole Group
Preliminary TDA
MINISTER OF TRANSPORT
BELIZE PORTS AUTHORITY BOARD
PORTS COMMISSIONER
PILOTAGE COMMITTEE
HARBOUR MASTER
FINANCIAL CONTROLLER
DEPUTY HARBOUR MASTER
ADMINISTRATION DEPARTMENT
FINANCE DEPARTMENT
MARINE DEPARTMENT
CHIEF SECURITY OFFICER
SECURITY SECTION
SECURITY OFFICERS
LIGHTHOUSE KEEPERS
COXSWAINS
(ASST LIGHTHOUSE KEEPERS)
SEAMEN
MARINE ENGINEER
June 2, 2003
56
Abt Associates Inc. / Woods Hole Group
ADT Preliminar
4.2.2
Guatemala
The maritime administration in Guatemala is stipulated by the National Law (Decreto Ley No. 19-83,
March 1983) that designates the Ministry of Communications Transportation and Public Works
(Ministerio de Communicaciones Transporte y Obras Públicas) as the lead ministry for maritime
transportation. However, the Ministry has not assumed a leadership role and the country has effectively
operated without a national maritime authority. It is interesting to note that Guatemala is the Central
American country that has ratified the greatest number of international maritime conventions, although
the conventions remain without implementing regulations and maritime authority with resources and
personnel to execute its legal mandates.
The Municipal Code (Decreto 58-88 de Congreso de la Repblica) stipulates that the municipalities must
create an environmental commission. Each port in Guatemala is essentially considered a branch office
("cabecera") and Article 56 of the Code requires the establishment of an environmental commission at the
port.
The National Port Commission (Comisión Portuaria Nacional) was created in 1972 by national law
(Acuerdo Gubernativo del 10 de marzo de 1972). The Commission is charged with protecting
Guatemala's national interests related to port activities and representing the nation in international fora.
In the absence of a national maritime authority, the CPN has supported program activities from the IMO
and other international institutions.
The National Port Company (Empresa Nacional Portuaria) is a quasi-governmental institution that
functions semi-autonomously. National legislation outlines the organization of the company and the
membership of its steering committee including:
· A President that is a representative of the President of the Republic
· Representatives from the Ministry of Communications, Infrastructure and Housing
· Ministry of Public Finances
· Ministry of National Defense
· A Representative from the labor union of the company
The two ports participating in the GEF Project are Puerto Santo Thomas de Castilla and Puerto Barrios.
Puerto Santo Tomás is operated by the Empresa Nacional Portuaria. Some operational areas of the port
are concessioned. Puerto Barrios is operated through a concession to the Compańia Bananera
Independiente de Guatemala S.A. (COBIGUA). The administration at Puerto Barrios reports a positive
working relationship with both the CPN and COCATRAM. Environmental problems that have been
identified at Puerto Barrios include lack of wastewater treatment and improper application and disposal of
pesticides by the banana growers. At Santo Tomás there have been problems with improper handling of
hazardous waste.
The national law of the Naval Police (Acuerdo Gubernativo 326-85) designates the National Defense
Ministry as the responsible institution for policing the national waters and port installations. The
regulation for the policing of ports (Acuerdo Gubernativo del 21 de Abril de 1939) delegates to the
Commander and Port Captain the authority to provide indications concerning ballast water discharge and
disposal of ship wastes. A special unit was created by the Ministerio de la Defensa Nacional called the
Dirección de Asuntos Maritimos to act as the focus within the government for pollution prevention and
national oil spill contingency planning.
June 2, 2003
57
Abt Associates Inc. / Woods Hole Group
Preliminary TDA
The Ministry of Communication, Infrastructure and Housing was created in 1971. The Ministry is
charged with the construction and maintenance of the nation's transportation systems by air, land and
water. The Ministry is also responsible for the nation's compliance with international treaties.
58
Abt Associates Inc. / Woods Hole Group
Preliminary TDA
Figure 4.2-2. Maritime Organization in Guatemala
Maritime Administration Guatemala
EJECUTIVO
MINISTERIO DE COMUNICACIONES
MINISTERIO DE FINANZAS PUBLICAS
INFRAESTRUCTURA Y VIVIENDA
EMPRESA
COMISIÓN
EMPRESA PORTUARIA
EMPRESA
FERROCARRILES
PORTUARIA DE
PORTUARIA
SANTO TOMAS DE
PORTUARIA
NACIONAL
DE GUATEMALA
CHAMPERICO
CASTILLA
QUETZAL
TERMINAL PORTUARIA
PUERTO
DE BARRIOS COBIGUA
SAN JOSÉ
June 2, 2003
59
Abt Associates Inc. / Woods Hole Group
Preliminary TDA
4.2.3
Honduras
Several ministries share jurisdiction for programs covering marine pollution control, protected areas,
coastal planning, and navigational safety. The Merchant Marines (Direción Nacional del Mercante
Marina, DGMM) are responsible for a range of regulatory responsibilities that together form one of the
Honduran government's primary institutions for the overall control of maritime pollution. The Merchant
Marines was reorganized and strengthened into its existing structure when the Honduran Congress passed
the National Merchant Marines Law (Ley Organica de la Marina Mercante Nacional, Decreto No. 167-
94) in 1995. The Law provides the regulatory framework outlining activities to be executed by the
Merchant Marines including the prevention of pollution generated from ships, platforms or other
installations within the legal zone corresponding to Honduras, oversight of salvaging operations,
inspections, and certifications of compliance with national and international requirements related to
security and pollution as established by MARPOL.
The port system in Honduras is administered by the National Port Authority (Empresa Nacional Portuaria,
ENP). The Port Authority was created in 1965 by the Legislative Decree No. 40. It was created as a
semi-autonomous, decentralized organization with its own authorizing law and regulations. The Port
Authority is able to concession certain port operation functions.
In 1990, the Honduran government initiated a modernization program aimed at improving the efficiency
of government operation. The vehicle for the le gal and institutional reform was the National
Modernization Law (Proyecto de Ley para la Modernización del Estado) of January 1992, which created a
Presidential commission for the modernization of the country. As part of the modernization initiative, the
government of Honduras was to evaluate and strengthen the Port Authority. The Port Authority was to
undergo an analysis to determine means of increasing private sector participation in port operations,
define the institutional role of the Authority, and restructure the institution. Assessments of the initiative
have found no substantive progress in the objectives. The result is that the Port Authority continues to
operate under a framework of often vague and conflicting legal requirements. The organization of the
National Port Authority is provided in Figure 2.
Honduras has six commercial ports. The principal national port in Honduras is Puerto Cortes and is the
only port in Honduras participating in the IDB-GEF Project. At Puerto Cortes, the operations related to
cargo loading, and transportation, fumigation and maintenance of the port sites and other related container
services are concessioned.
Figure 4.2-3. Organization of the National Port Authority in Honduras (next page)
June 2, 2003
59
Abt Associates Inc. / Woods Hole Group
ADT Preliminar
CONSEJO DIRECTIVO
EMPRESA NACIONAL
PORTUARIA
GERENCIA GENERAL
AUDITORIA INTERNA
ORGANIGRAMA
SUB GERENCIA
ASESORIA
UNIDAD ENLACE
INFORMATICA
TESORERIA
ZONA LIBRE
CONTROL DE CONT. Y DROGAS
DIVISION DE
DIVISION DE RECURSOS
DIVISION
DIVISION
DIVISION SERVICIOS
CONTABILIDAD
HUMANOS
TECNICA
PLANIFICACION
GENERALES
GRAL.
ADMON.
COSTAS,
NOMINAS
OBRAS
COMPRAS
SUMINISTROS
PERSONAL
BIENES Y
CONT. Y
CIVILES
ESTADISTICAS
FRONEDADES
MEDICIONES
REL.
SERV.
CAPACITACION
CENTRO DE
INDUSTRIALES
ADTIVOS Y
SERV.
GENERALES
SERV. AL
SEGUROS
PERSONAL
SUPERINTENDENCIA PERTO
CORTES
SUPERINTENDENCIA
FACT. Y ATENCION AL
PLANIF. CONTROL Y
PUERTO CASTILLA
USUARIO
SUPERVISION
ADMON
OPERACIONES
POLICIA PORTUARIA
OPERACIONES
FOTUARIA
YARDAS, TRAFICO Y
SEG. E HIGIENE
POLICIA
ALMACENES
INDUSTRIAL Y AMB.
PORTUARIA
MANTENIMIENTO DE
SERV. MARITIMOS
EQUIPO
ELECTRICIDAD Y
MANEJO DE CARGA
ELCTRONICA
June 2, 2003
60
Abt Associates Inc. / Woods Hole Group
Preliminary TDA
4.3
Other Project-Related Program Areas
Belize
The Coastal Zone Management Authority (CZM) was established by the Coastal Zone Management Act
and is located organizationally under the Ministry of Agriculture, Fisheries and Cooperatives. The
Authority is an autonomous public statutory body responsible for implementing the use and development
of the coastal zone in Belize. The Authority addresses issues of overlap in legislation and institutional
strengthening. It consists of a Board of Directors appointed by the Minister and a Chief Executive Officer
appointed by the Board. The CZM Institute carries out the technical functions of coastal management in
coordination with various government agencies.
The Department of the Environment is organized under the Ministry of Natural Resources and
Environment. The Department is responsible for all aspects of environmental protection and review of
Environmental Impact Assessments. Discharges from terrestrial sources including sewage, dumping and
hazardous waste are subject to effluent limit and require a discharge permit and monitoring.
Pollution control from ships is regulated through the Maritime Areas Act (January 19, 1992). The content
of the law has been difficult to enforce due to vague guidelines. Enforcement has been primarily through
review of ships' records. The Belize Defense Force is responsible for ship-based pollution, although the
Environmental Department and Public Health may also participate. The Environmental Department is
responsible for terrestrial sources along with the Public Health Department. The Coastal Zone
Management Authority conducts inter-institutional coordination.
Since the establishment of legislation to protect Belize's cultural and natural resources came into effect,
more than 50 declared protected areas in both terrestrial and coastal/marine environment have been
established. The legal framework for protected areas includes a network of laws. The Forestry and
Fisheries Departments are responsible for the compliance with protected areas legislation and regulation.
The Ministry of Natural Resources and the Ministry of Agriculture and Fisheries are responsible for
compliance with management plans.
August, 2003
61
Abt Associates Inc. / Woods Hole Group
Preliminary TDA
Figure 4.3-1. Belize Government Structure for Environmental Protection
Ministry of Natural resources,Environment, and Industry of Belize
Geology &
Dept. of Lands
Department of
Hydrology
Forestry Dept.
Petroleum
Environment
Department
Department
Ministry of Transport
Attorney General Ministry
Minstry of Agriculture & Fisheries
Fisheries Dept.
Port Authority
IMMARBE
CZMAI
August, 2003
62
Abt Associates Inc. / Woods Hole Group
Preliminary TDA
Guatemala
The Environmental Ministry was established in 1986 by the national law (Decreto 68-86, Ley de
Proteccion y Mejoramiento del Medio Ambiente) as the National Environmental Commission (Comisión
Nacional de Medio Ambiente, CONAMA). The agency was reorganized and renamed to the Ministerio
de Ambiente y Recursos Naturales in 2000. The Ministry is charged with the preservation of the
environment including the application of environmental norms and environmental impact assessment.
The Ministry of Health and Social Services (Ministerio de Salud Pública y Servicios Sociales) is charged
with both protecting public health and certain aspects of environmental health. It has jurisdictional
responsibilities to develop and promulgate environmental clean up standards and enforce their
application. The regulations for maritime sanitation apply international sanitary standards and hygiene
related controls to ships, ports and their surroundings.
Protected areas are administered through two agencies with the National Council of Protected Areas
(Consejo Nacional de Areas Protejidos, CONAP) with lead jurisdiction. CONAP shares some
responsibilities with the Office for the Control of National Reserves.
August, 2003
63
Abt Associates Inc. / Woods Hole Group
Preliminary TDA
Figure 4.3-2. Guatemala Government Structure for Environmental Protection
Min. de
Ministerio de
Ministerio de
Comunicaciones
Ambiente y Recursos
CONAP
Defensa
Infraestructura y
Naturales
Ministerio de
MAGA
Minería
vivienda
EIAS
ONGs
Consejos
Consultivos
La Marina de
Defensa
Nacional
SAM
CBM
August, 2003
64
Abt Associates Inc. / Woods Hole Group
Preliminary TDA
Honduras
The national environmental law provides the Secretariat for Natural Resources and the Environment
(Secretaria de Recursos Naturales y Ambiente, SERNA) with diverse responsibilities as part of its legal
mandate to implement measures to protect natural resources; and prevent, control, and clean up of
pollution. The law has regulations that authorize government agencies to elaborate standards for emission
of contaminants into the environment and where national standards are absent to use international
standards adopted by the Honduran government. The agency is responsible for complying with
international conventions and treaties. SERNA is responsible for the issuing environmental licenses after
the review and approval of an Environmental Impact Assessment.
In the Protected Areas Program, SERNA shares responsibility with the Forestry Agency (Corporación
Hondureńa de Desarrollo Forestal, COHDEFOR) for the administration of protected areas. The shared
responsibility is divided between planning and implementation responsibilities. SERNA is responsible
for the development of government policies and norms and COHDEFOR for program implementation.
SERNA is responsible for the inter-institutional coordination that includes the role of municipalities (Art.
29, Ley General del Ambiente) in the management of protected areas. International coordination has been
conducted through CCAD allowing high-level coordination on matters concerning the environment and
sustainable development.
The Transportation and Housing Secretariat (Secretaria de Estado de Obras Publicas, Transporte y
Vivienda, SOPTRAVI) is responsible for all aspects for public works, transportation and housing issues.
The ministry has a high level of coordination with DECA (Dirección General de Evaluación y Control
Ambiental) through the National System of Environmental Impact Assessment. Government focus has
been primarily on roadways. SOPTRAVI has some involvement with protected areas and coordinates
activities with the National Forestry Agency (COHDEFOR).
The Health Ministry (Ministerio de Salud) is brought into the project scope through its jurisdiction over
sanitation issues that include port facilities. The agency is also responsible for water quality issues related
to public health.
The Labor Ministry (Ministerio de Trabajo y Asistencia Social) is responsible for ensuring compliance
standards designed to provide safe work conditions including work condition at sea.
August, 2003
65
Abt Associates Inc. / Woods Hole Group
Preliminary TDA
Figure 4.3-3. Honduras Government Structure for Environmental Protection
Secretaría de
Obras Públicas
SERNA
Transporte y
Vivienda
Subsecretaría
Subsecretaría de Ambiente
de Energía
ENP
DECA
DIBIO
CESCO
DGA
Dirección de
Dirección de
Recursos
Energia
Hídricos
Areas
SINEIA
Protegidas y
IHT
Vida Silvestre
COHDEFOR
SINEIA-- Descentralizadoen UMA's
SOPTRAVI-- Secretaría de Obrsa Públicas de Transporte y
Vivienda
IHT-- Instituto Hondureńo de Turismo
DECA--Dirección de Evaluación y Control Ambiental
DIBIO--Dirección General de Biodiversidad
COHDEFOR--Corporación Hondureńa de Desarrollo Forestal
CESCO--CEntro de estudios y Control de Contaminantes
August, 2003
66
Abt Associates Inc. / Woods Hole Group
Preliminary TDA
5.0 Major Perceived Problems and Issues
The identification of the major perceived1 problems and issues (MPPI) and their causes is a first step in
the TDA process and it constitutes the justification for the subsequent in-depth analyses. The significance
of the perceived issues and problems should be substantiated on scientific, environmental, economic,
social, and cultural grounds. The MPPIs and their causes should represent the perceptions of the
scientific and expert community on the priority environmental issues of the region. The experts may
come from the scientific community, the NGO community, government, and other stakeholder groups.
This section of the TDA analyzes the primary MPPI identified in the region and its causes to examine the
technical basis supporting or refuting each cause as a priority issue in the Gulf of Honduras. The intent is
to provide a technical rationale for prioritizing the causes in order to help guide the direction of future
interventions to improve the Gulf of Honduras environment. It will be of no use to identify major
intervention efforts for an MPPI and its cause if the technical basis supporting its priority is missing. In
such a case, either the cause can be dismissed as a non-priority issue, or just as importantly, gaps in
knowledge can be identified, and filling the gaps can become the next step towards addressing that
particular MPPI and its cause.
This section, therefore, relies on the literature generated by the scientific community, by governments,
and by non-governmental and inter-governmental organizations to determine the technical basis for each
cause of the MPPI. The major sources of information are listed within each individual section as well as
in the References accompanying this TDA. Given the limited size of this TDA, not all information
available in the region can be included in this section.
The following MPPI has been identified as the priority in the Gulf of Honduras region:
Degradation of Coastal and Marine Ecosystems
The following primary causes of the MPPI have been identified and are examined in detail in the
following sections:
·
Negative environmental effects arising from existing and future port operations and infrastructure
development
·
Negative environmental effects arising from marine activities
·
Other Land-Based Activities (other than shipping-related) causing degradation of the ecosystems of
the Gulf of Honduras
Statement of the problem/issue
As is discussed in more detail in section 2.5, the Gulf of Honduras and surrounding waters include a
variety of ecologically important ecosystems. The coastal ecosystems of the region are generally both
rich in natural resources and highly productive. Important habitats include mangrove forests, coral reefs
and seagrass beds. The world's second largest barrier reef system extends into the Gulf, containing a
variety of corals and serving as habitat for marine species. Much of the coast is lined with mangrove
forests that provide a vital role in coastal ecosystem processes. Seagrass beds cover large sections of the
Gulf. These sensitive ecosystems serve as habitat for and contribute to the wealth of marine fishes and
mammals that inhabit or travel through the Gulf, some of which are endangered, such as the manatee.
There is great interconnectivity between the ecosystems. The integrity of each ecosystem is dependent on
1 "Perceived" is used to include issues which may not have been identified or proved to be major problems as yet due to
data gaps or lack of analysis or which are expected to lead to major problems in the future under prevailing conditions.
August, 2003
67
Abt Associates Inc. / Woods Hole Group
Preliminary TDA
the health and influence of adjacent ecosystems. For example, there is nutrient, sediment, and organic
matter interchange between the coral reefs and mangrove ecosystems.
A wide variety of terrestrial ecosystems also exist in the watershed of the Gulf of Honduras.
Figure 5.1-1. Ecosystems of the Gulf of Honduras and its Watershed
(See Appendix D)
Coral reefs and mangroves are the most biologically diverse ecosystems and greatly at risk. Coral reefs
grow in clear water and reefs growth is extremely sensitive to pollution, whether due to chemical
contaminants or suspended sediments. The rapid expansion of coastal populations and consequentially
increased loads of domestic sewage, agricultural runoff and industrial effluent to the marine environment,
as well as the increased maritime operations and traffic, represents a significant threat to the coral reef
habitat.
Coral reefs in the Gulf have shown signs of degradation in recent years. As is discussed in section 2.5,
bleaching has occurred. Bleaching may be due more to global human impacts (climate change) rather
than local effects. However, it is still of concern due to the vast size of the coral barrier. Additionally,
recreational boats as well as commercial ships have hit coral and broken corals. The extent of the
degradation of the reefs due to boating accidents, water pollution and global warming has not been fully
assessed, however.
Significant areas of mangrove forests have been cut down in the Gulf, either for the wood or to make way
for agriculture or coastal development. Specific data on the amount of area cleared are not available,
however. It is also not known whether the remaining stands have suffered degradation from land-based
and marine-based sources of pollution.
The status of seagrass beds in the Gulf of Honduras has not been adequately assessed. It is unclear
whether these ecosystems have suffered degradation due to pollution from land and marine-based sources.
The primary contributors to the degradation of the coastal and marine ecosystems are:
·
Port operations and infrastructure development.
·
Marine activities such as marine discharges, collisions, groundin gs, etc.
·
Non-shipping related land-based activities.
Each of these causes is examined in detail below, their concrete contributions identified, and the
magnitude of their impacts is supported by data where available.
Transboundary elements
·
Loss of income from regional and global trade of marine products
·
Marine living resources are often migratory
·
Coastal zone habitats are the backbone for the productivity of marine and coastal habitats
·
The coastal habitats provide feeding and nursery grounds to migratory species
·
The coastal habitats are accumulating transboundary pollution
·
Degradation of coastal habitats contribute to the overall decline of regional and global biodiversity
·
Regional-wide destructive activities degrading coral reefs, mangroves and seagrass habitats
August, 2003
68
Abt Associates Inc. / Woods Hole Group
Preliminary TDA
·
The sustainability of marine and coastal biodiversity depends on the integrity of the interlinked
ecosystems that supports all trophic levels in the food chain.
·
Damage to transboundary ecosystems
Environmental impacts
·
Loss of biodiversity
·
Loss of natural productivity
·
Reduction of fish stocks
·
Effects on number and distribution of global population of certain migratory species
·
Changes in coastal ecosystems
·
Depletion of mangroves
·
Degradation of coral reefs
·
Reduction in value of marine resources
·
Degradation of coastal landscape
·
Changes of the hydrological regimes
·
Changes in food web
·
Increased vulnerability of commercially important species
·
Long term changes in genetic diversity
·
Stock reduction
·
Habitat degradation due to destructive fishing techniques
Socioeconomic impacts
The degradation of coastal and marine ecosystems by maritime and land-based activities leads to the
degradation of the interdependent habitats and reduced fish catches. For example, a reduction in seagrass
or mangrove cover can reduce fish spawning, leading to reduced catches, which has both social and
economic implications, particularly for artisanal fisheries. Additionally, degraded habitats reduce the
tourism potential. Some of the most important impacts include:
·
Reduction in income from fisheries
·
Reduction in income from tourism industry
·
Changes in employment
·
Loss of aesthetic value
·
Loss of cultural heritage
·
Conflicts between user groups
·
Loss of recreational opportunities
Causal chain analysis
See Appendix B.
August, 2003
69
Abt Associates Inc. / Woods Hole Group
Preliminary TDA
5.1
Negative Environmental Effects Arising from Existing and Future Port Operations and
Infrastructure Development:
Marine transport has important environmental consequences. The Gulf of Honduras ports are located
adjacent to important sensitive coastal and marine ecosystems that are threatened by the shipping
activities. Daily port operations as well as the risk of ship collisions or large oil spills pose a significant
risk to coastal ecosystems, particularly in the semi-enclosed Bahía de Amatique. Currently, there are no
environmental management systems implemented in the ports included in this study to mitigate the risks
from the shipping operations. Environmental threats posed by the ports in the region include:
·
Environmental effects from port expansion and maintenance activities, such as dredging.
·
Accidental spills during the loading, offloading and storage of cargo, particularly during the handling
of hazardous materials.
·
The absence of contingency plans in case of an accident.
·
Inadequate capacity to meet the standards established by the MARPOL Convention related to the
operational discharge of solid wastes and oily ballast, and lack treatment of ballast water.
Each of the five ports included in the current study is discussed below in terms of management,
infrastructure and capacity to address environmental problems. The volume and type of goods received at
the ports is also discussed, but more detailed information is included in Appendix C.
Belize City Port
Belize City Port was privatized in January 2003 and it is now owned and operated by the Port of Belize
LTD. The Belize Port Authority is the regulatory body overseeing the port. Figure 5.1-1 shows the main
infrastructure of the port.
Figure 5.1-1. Belize City Port
(See Appendix D)
In 2000, 46% of the total cargo imported by sea to Belize entered through the Belize City Port (Port of
Belize Limited, 2002). The major products exported from Belize by sea include citrus concentrate,
bananas, sugar, molasses, dolomite, seafood, papaya, beans and lumber. The main cargo imports into the
Belize City Port are fuel, dry bulk, steel and finished goods. Fuel imports are handled by the Esso
Corporation through their terminal adjacent to the Belize City Port. Dry bulk imports include wheat,
animal feed and fertilizer. Finished goods shipped through the port are containerized. Break bulk cargo
consisting of low value bagged foodstuffs or steel is occasionally shipped through the port. See Appendix
C for more detailed information on port cargo.
The number of ships using the Belize City Port is rapidly expanding. Belize recently has seen an
explosive increase in the cruise ship industry. In 2001, there were 51 cruise ship calls. In 2003 it is
forecast that 339 ships will visit Belizean ports and this number is expected to increase to 401 cruise ships
in 2004. These figures do not include the "pocket cruise" ships or mega yachts that are under 300' in
length. On average there are 350 cargo vessels per year, 80 of which are tankers. Fuel barges that
maintain service to outlying Cayes average 60-80 voyages per year carrying a total of approximately
41,000 barrels of gasoline and 42,000 barrels of diesel fuel, classified as a class 3 pollutant.
Port of Belize LTD now has responsibility for environmental management of Belize City Port under the
regulation of the Department of the Environment, in conjunction with the Department of Fisheries and the
August, 2003
70
Abt Associates Inc. / Woods Hole Group
Preliminary TDA
Belize Port Authority (BPA). The ability of Port of Belize LTD to effectively deal with environmental
issues has not yet been determined.
Belize has a National Emergency Preparedness Plan for Oil Spills (NEPPOS) which was prepared by the
University of South Alabama, Center for Emergency Response Training in 1996 and funded by the
United States Agency for International Development (USAID). The Department of the Environment is
responsible for implementation of the plan, but in the case of the use of dispersants it has joint
responsibility with the Department of Fisheries. The plan provides for the supply of oil spill response
equipment from the Clean Caribbean Co-operative (Oil Response Center) in Fort Lauderdale, Florida.
Esso Belize's Loyola Terminal also has an Oil Spill Response Contingency Plan. Although some
equipment is held at the Loyola Terminal, this plan calls for the use of the services of the Clean Caribbean
Co-operative.
The port was constructed from pre-stressed concrete T-piers, beams and open pile platform pierheads
supporting heavy-duty decks, made of steel gratings. The piers are connected to shore by single-lane
trestle bridges. The Belize City Port is located 800 m offshore and has 67 m of berths, 5.18 m of natural
draught, 4.6 m draught for the roll-on, roll-off (Ro-Ro) berthing of approximately 25 m length and is
serviced by one mobile Manitowoc crane with a capacity of 140 tons, 1 Hyster Forklift with a capacity of
50 tons, 1 Super Stacker with a capacity of 49.5 tons, 5 Hyster Forklifts with a capacity of 5 tons each and
4 Dock tractors with 12 trailers. The port also has a transit shed measuring 6,583 m2, a main container
yard totalling 30,968 m2 and various sheds, ships and spare parts storage areas.
Big Creek
Big Creek, officially called Toledo Port, is a small private port administered by Banana Enterprises and
regulated by the Belize Port Authority (BPA) in Belize City. It is located between 16ş25'50'' latitude
north and 88ş21'50'' longitude west. Figure 4.1-2 shows the main infrastructure of the port and its
navigational channel.
Figure 5.1-2. Port of Big Creek
(See Appendix D)
Bananas and citrus are exported on a weekly basis. Additionally, the company Savannah Resources uses
this port to export pine roots to the United States through special ships three times per year. The only
imports received at the port are equipment and products for the banana industry and port, which are
brought in by a ship every three weeks. The current port owners have plans to try to increase the amount
of imported products coming through the port if the mandate from the port authority is changed to allow
it, however.
In Big Creek, all environmental and industrial safety activities are evenly distributed among the port
operations' personnel as no separate entity exists to coordinate and address environmental issues. In
general, the capacity for handling environmental problems is low and in the past the port has had to hire
external experts to perform assessments. Environmental issues are regulated by the Department of the
Environment, according to the Marine Environmental Protection Act 1992, and the Belize Port Authority,
according to the Belize Ports Authority Regulations.
Big Creek has a marginal dock with a length of 300 m, depths of up to 6.7 m and an area of about 12 ha.
This port has a movable crane with a capacity of 65 tons, a tugboat, freig ht elevators, and courtyards for
containers and general cargo. Additionally, two warehouses are located at the port behind the quay.
There are two tanks for the storage of chicken feed that belong to the Mennonite Church and another tank
August, 2003
71
Abt Associates Inc. / Woods Hole Group
Preliminary TDA
for the storage of water. The port is equipped with a fire pump, which functions using seawater, and
extinguishers (most of them of 12 kilos).
Puerto Santo Tomás de Castilla
This port offers the services of an international port with an Industrial and Commercial Free Zone
(ZOLIC) located next to it. It is a multipurpose port, administered by the Empresa Portuaria Nacional
Santo Tomás de Castilla (EMPORNAC). It is located between latitude 15ş 57' 8'' North and 88ş 37' 24''
longitude West and serves as Guatemala's main port on the Atlantic coast. The port is currently operated
by the central government (the ultimate port authority). Figure 5.1-3 shows the main infrastructure of the
port and its navigational channel.
Figure 5.1-3. Puerto Santo Tomás de Castilla
(See Appendix D)
Products imported via the port include refined oil products, paper products, chemicals, metal products, oil
and grease. Exported products include bananas, coffee, fruit, vegetables, meat, seafood and crude oil.
The port has patios of containers with a storage capacity of 5000 TEU. Conventional ships, container
carriers, multipurpose, Ro-Ro, solid bulks, liquid bulks, frigates, launches and cruise ships operate in the
port; during the year 2001, 1262 ships docked in this port, mobilizing a cargo more than 4,500,000 tons
(including imports and exports). In 1999, the volume of the goods handled by the port represented 44%
of all goods imported and exported through Guatemalan ports, and 73% of the volume handled on the
Caribbean coast. Between 1995 and 1999, the volume of goods handled by the port increased an average
of 12.1% annually (SIECA, 2001). Between 1995 and 1998, the greatest increase in types of cargo
moving through the port was petroleum (23.6%), followed by Roll-on Roll-off (18.3%), containerized
(11.2%) and general cargo (9.8%) (SIECA, 2001). In 1998 the ships stayed at the port an average of
27.04 hours. In 1997, the rate of occupation at the port was 49.33% (SIECA, 2001). According to a
SIECA study, the port has the capacity to handle 6,314,243 tons annually, which is 42% more than it
handled in 1998 (SIECA, 2001). See Appendix C for more detailed information on the cargo imported
and exported through the port.
Santo Tomás de Castilla has an Industrial Safety Department, which is also in charge of the port's
environmental issues. The current capacity to address environmental issues is low, but plans exist to
enhance the environmental unit.
The port has a shore-attached dock with an estimated length of 915 m (distributed as six docks of 152 m
each). The height above sea level of docks 1, 2 and 3 are 2.5 m ± 0.25 m, and for docks 4, 5 and 6 are 2.7
± 0.25 m, with a maximum depth of 9.5 m. A portico crane cannot be installed for the handling of
containers due to the docks' bearing capacity (only of 2.9 tons/m2). The port also has a turning basin that
is 906 m long and 150 m wide and is positioned from East to West. The turning basin is 667.64 m2 with a
depth of 11 m. It has 4 storage buildings for all types of cargoes, one for reels and banana and another for
vehicles. It also has courtyards with a total area of 197,017 m2 for the storage of filled and empty import
and export containers and a courtyard with 208 electrical plugs for refrigeration containers.
The following equipment is located at Puerto Santo Tomás de Castilla:
·
tugboats of: 450 HP, 1600 HP, 1500 HP and 2720 HP
·
2 sailing-master launches of 150 HP and 32.8 HP
·
1 belay launch of 400 HP
August, 2003
72
Abt Associates Inc. / Woods Hole Group
Preliminary TDA
·
2 multi-purpose cranes of 104 metric tons
·
2 movable cranes of 30 metric tons
·
2 movable cranes of 10 and 20 metric tons
·
Hoists: 39 of 4 metric tons, 5 of 5 metric tons, 15 of 5 metric tons, 2 of 9 metric tons and 1 of 18
metric tons
·
2 front loaders, one of 40 metric tons and another of 7 metric tons
·
14 container carriers: 7 of 35 metric tons and 7 of 40 metric tons
·
45 deck terminals with capacity of 25 metric tons
·
49 gondola-cars: 46 of 20 metric tons, 2 of 10 metric tons and one of 20 metric tons
Puerto Barrios
Puerto Barrios, Guatemala's first private seaport, is privately owned and has been administered by the
Independent Banana Company of Guatemala, S.A. (COBIGUA, member of Chiquita Brands) since 1989.
It is located between latitude 15ş 44' 3'' North and longitude 88ş 36' 21'' West. Figure 5.1-4 shows the
main infrastructure of the port and its navigational channel.
Figure 5.1-4. Puerto Barrios
(See Appendix D)
The port takes in refined oil products (Texaco), fertilizers (bulk), paper products, resin and bulk iron.
Bananas, melons, fertilizers, vegetables and cloth are the principal products exported through the port.
Puerto Barrios has a storage capacity of 1200 TEU. In 1999, the volume of the goods handled by the
port, 1,705,000 tons, represented 16% of all goods imported and exported through Guatemalan ports. In
1999, containerized cargo represented 78% of the volume moved through the port, with bananas being the
main product exported. Combustibles and petroleum derivatives for TEXACO represented 12% of the
volume (SIECA, 2001). In 1999, 583 ships visited the port, which is an average of 1.6 ships per day or 1
ship every 15 hours (SIECA, 2001). Ships stayed an average of 21.16 hours at the port. According to a
SIECA study, Puerto Barrios has the capacity to handle 2,453,142 tons annually, which is 44% more than
it handled in 1999 (2001).
Puerto Barrios has an Industrial Safety Department, which is also in charge of the port's environmental
issues. The port has a reasonable capacity to address environmental issues and appears to be willing to
further improve in this area. Although there is no national or regional administration currently overseeing
the port, it maintains good contact with and gets support from COCATRAM.
At Puerto Barrios and Puerto Santo Tomás de Castilla a contingency brigade has been formed, involving
representatives from the civil and military authorities, industries with activities related to the port sector,
environmental non-governmental organizations and port-related industries. This brigade has been
working together to prepare to face an emergency situation that could happen inside the ports' facilities,
such as a spill during the loading and offloading of cargo.
Puerto Barrios has a detached dock with a capacity for four berths (two for the southern side and
two for the northern side), a draught of 9.5 m, 125 m2 of maneuvering dolphins at both sides of
the main dock, areas for the filling and emptying of containers, container-weighing services,
general cargo and bulk services, and a navigational aids system including buoys and lighthouses.
August, 2003
73
Abt Associates Inc. / Woods Hole Group
Preliminary TDA
It also has a 24-hour electronic surveillance system activated by means of a control and
monitoring alarm center, an enclosed television circuit along the entire terminal, as well as
access and anti-narcotic controls.
The following equipment is located at Puerto Barrios:
·
7 Sideloaders with a capacity of 35 metric tons
·
2 Sideloaders with a capacity of 6 metric tons
·
Freight elevators: 9 of 4 metric tons, 8 of 3 metric tons and 2 of 10 metric tons
·
2 mill-hoppers with a capacity of 5 metric tons and 2 mill-hoppers with a capacity of 19 metric tons
for the unloading of solid bulks
·
5 deck terminals
·
24 transference deck terminals
·
3 tugboats of: 5950 HP, 957 HP and 850 HP
Puerto Cortés
Constructed within a natural bay, Puerto Cortés is Honduras´ major port with one of the best port
infrastructures in Central America. This port is administered by the National Port Enterprise (ENP), but
private companies operate parts of the port. It is located at 15ş51' latitude North and 87ş57.7' longitude
West. It has a turning area 900 m in diameter. Figure 5.1-5 shows the main infrastructure of the port and
its navigational channel. Additionally, the major infrastructure and areas of environmental concern
identified during an EIA of the port are indicated (DDH, 2002)
Figure 5.1-5. Puerto Cortés
(See Appendix D)
Products imported through the port include refined oil products, foodstuff, fertilizers, wheat, coal, steel
and iron. Export products include bananas, fruit, coffee, wood and minerals. In 1999, Puerto Cortés
handled 89%, or 4,978,083 tons, of the goods transported in and out of Honduras via maritime routes.
The port handled 1,728 ships that year. Between 1992 -1999, the volume of goods handled increased on
average 8.52% annually (SIECA, 2001). In 1999, 33% of the ships handled were containerized, 9% were
RO-RO, 19% were refrigerator, 18% had general cargo, and 6% had petroleum (SIECA, 2001).
According to a SIECA study, the port's capacity is 5,837,664 tons and the rate of occupation of the port
in 1999 was 59.7%. UNCTAD recommends that an acceptable occupation for a port of this size is 70%
(2001).
The Jefe de Departamento de Seguridad e Higiene Industrial y Gestion Ambiental is responsible for
environmental issues, security and industrial hygiene in the port. The local Environmental Management
Unit is responsible for requesting an EIA for every activity or project developed within the port's
facilities. The port has good relations with COCATRAM and is under a strong central administration.
The most important aspect to mention related to the environmental matters is the initiative of the port
authority in signing an agreement as part of the international framework for the cooperation between the
Empresa Nacional Portuaria, the Canadian Agency for International Development (ACDI) and DDH.
The main objective of this project was to develop an environmental management project in Honduras´s
ports, using Puerto Cortés as a model. Puerto Cortés is the only port in the region to have undertaken
such a project.
August, 2003
74
Abt Associates Inc. / Woods Hole Group
Preliminary TDA
The project consists of 4 phases. The first phase included an environmental diagnosis of the ports'
operating conditions. The second phase consisted of an assessment of the environmental status of the bay
and of the port facilities in Puerto Cortés. Recommendations for action were also given. The third phase
of this project consists of the design of the Municipality's Environmental Management System (SIGMA),
as well as the identification and inventory of all the equipment and materials required to handle an
emergency. Included in this phase is the development of an emergency brigade from all of the sector's
enterprises. Only the first two phases of the project have been carried out to date, however. At this time
funding is being sought to purchase the equipment required for carrying out the third phase of the project.
The port currently has 5 mooring docks: two of them are breakwater docks (one is being used for the
discharge of crude oil-derived products and the other one for the handling of liquid bulks such as
molasses, feed, oil and chemicals), and the remaining 3 are marginal docks.
Two of the docks have portico cranes with a capacity of 45 tons each to provide service to the container
carriers and Ro-Ro boats. The port is acquiring a Post-Panama crane which is expected to increase the
volume of cargo handled at the port. The containers´ terminal has an area of 47,936 m2, with 114
electrical plugs for the refrigerated containers. It also has a holding freezer with an area of 4,189 m2, with
6,700-ton capacity cranes. This cold storage room is being concessioned to a private company.
Table 5.1-1. Port Equipment
Type
Quantity
(units)
Tugboats
3
Sailing-master launches
2
Courtyard weighing machines of 60 tons
3
Storage weighing machines of 5,000 kg
2
Portico cranes of 45 tons
2
Movable cranes
7
Chassis
12
Dredges
24
Deck terminals
44
High-road deck terminals
4
Freight elevators of 3,000 pounds
9
Freight elevators of 6,000 pounds
9
Freight elevators of 8,000 pounds
23
Freight elevators of 8 tons
1
Freight elevators of 15,000 pounds
11
Port operations and activities identified with having the greatest environmental impacts on the Gulf of
Honduras are discussed below. The information contained in the following sections was provided by port
personnel at regional stakeholders meetings, during one-on-one interviews and through surveys.
Information was also obtained from port publications. Information in some sections is incomplete,
however, and will need to be obtained during the completion of the Final TDA.
5.1.1.
Port Expansion and Maintenance Activities
Dredging
August, 2003
75
Abt Associates Inc. / Woods Hole Group
Preliminary TDA
Navigational channels and ports must be dredged regularly due to siltation in order to keep them
accessible to large ships. Additionally, there are plans for expansion dredging at the ports to deepen and
widen channels and ports to allow even larger ships than currently can be accommodated to enter.
Siltation occurs as a result of natural processes, but also results from anthropogenic activities in the
watershed such as logging, agriculture and development of lands. Major storm events such as Hurricane
Mitch have also exacerbated siltation in the Gulf of Honduras. Ship traffic itself can affect the need for
dredging as passage of many ships in narrow channels can cause channel banks to collapse, reducing
water depths and enhancing dredging requirements.
There are a number of environmental concerns related to dredging activities. First, the act of dredging
can cause the removal of aquatic vegetation on the seafloor including seagrasses and corals. Second, the
suspension of sediments during the dredging process can harm aquatic species and damage nearby
sensitive seagrass beds, mangrove forests and coral reefs. Sediments in the vicinity of the ports,
particularly in Honduras, have been found to be contaminated with heavy metals and other persistent
toxic pollutants (Rambřll, 2000). Thus, dredging operations that are either inadequately planned or
incorrectly carried out could cause the release of contaminants and sediments into the water column.
Another concern is the disposal of contaminated dredged sediments. In the past, dredged sediments most
often have been used as fill material for expanding port infrastructure. It is unclear whether the
appropriate tests were conducted to determine whether it was safe to re-use the contaminated sediments.
In other cases, dredged material has been deposited in deep ocean areas, which also could pose a threat to
marine habitats.
Prior to privatization of Belize City Port, the government of Belize began a project to dredge the
important areas of Belize City Harbor including the areas immediately surrounding the port. According
to the plan, more than 2 million cubic yards of consolidated seafloor material were to be extracted and
used to reclaim a large area of swampland and mangrove forest adjacent to and south of the port. Some
of the acreage was to be used for further development of port facilities. The cost of the dredging project
was estimated to be US$ 18.4 millio n of which US$ 7.9 million was to be spent to construct an access
channel at the pierhead of Belize City Port and 4,600 m of access channel. The access channel
specifications are summarized below:
·
Turning Basin:
Length
600 m
Width
200 m
Dredging Depth
-10.0 m
·
Access Channel
Length
Approx. 4600 m (up to -10 m contour)
Width
120 m
Dredging Depth
-10.0 m
Port of Belize LTD is responsible for all future maintenance dredging of the access channel. Dredging
takes place when it is required and the Belize Port Authority is not currently aware of any planned
dredging activities. Any development project in Belize is required by law to be supported by an
Environmental Impact Assessment.
The access channel to Big Creek was dredged when the port operations began in 1989-1990 to a depth of
6.7 m, with a base width of 63 m on straight sections and 80 m on bends. The channel was designed for
vessels of length 110 m and draft 5.5 m. During the initial dredging, some mangroves were cleared to
make way for the dredger to operate. Salt spray from the spoil disposal operations also damaged
mangroves, causing some trees to lose their leaves, but the mangroves have since recovered.
August, 2003
76
Abt Associates Inc. / Woods Hole Group
Preliminary TDA
Although maintenance dredging does not appear to be necessary as there seems to have been little
deterioration of the depth of the channel, at least up until April 1998 (Posford Duvivier, 1998), the port
owners have plans to expand the navigational channel to allow larger ships to enter the port. Some
options that have been considered would include the loss of mangroves surrounding the port and channel,
as well as the removal of coral heads. All channel expansion options would also result in the disturbance
to sensitive species, including the manatee, and the re-suspension of sediment causing the smothering of
adjacent mangrove habitats. It is thought that damage from suspended sediments would not be extensive,
however, due to the weak flows of the creek (Posford Duvivier, 1998). Expansion of the navigational
channel would also result in an expansion of the port itself.
Puerto Barrios and Puerto Santo Tomás de Castilla share one navigational channel, which Puerto Santo
Tomás dredges every 20 years. The port of Santo Tomás practices general maintenance dredging every
10 years. Puerto Barrios practices maintenance dredging in its navigational channel every 3 years (due to
the direction of the currents, which may enhance sedimentation in its navigational channel). The dredged
material is transferred to deeper zones of Bahía la Graciosa and dredging operations are monitored by the
port. In 2000, 360,000 m3 were dredged from the access channel to increase its depth to 9.5 m. Dredging
in the Santo Tomás de Castilla Bay has been found to affect the marine environment in the region. The
coastal currents carry the sediments and suspended solids along the littoral towards the Bahía la Graciosa,
reducing water transparency and thereby diminishing productivity or causing the total loss of vegetation
(Yańez-Arancibia et al., 1998). Ships using Puerto Barrios pay a fee to Puerto Santo Tomás de Castilla,
which is used by EMPORNAC to carry out such duties as dredging and maintaining navigational aids.
The Empresa Nacional Portuaria of Honduras recently undertook the dredging of its access channel. To
accommodate the docking needs of larger vessels, approximately 3 km of channel were dredged, resulting
in 300,000 m3 of sediments. This created a channel depth of 14 m from a current depth of 12 m.
According to the Chief of the ENP's Technical Division, the port decided to transfer the dredged material
to an area approximately 1600 m to the northwest (inside a small channel with a depth from 25 to 35 m).
Research studies carried out in this zone indicate that the area along the port facilitie s' access channel is
surrounded by coral, but they are covered by a layer of sediments produced by the urban and up-river
discharges and are not in good condition.
Regular maintenance dredging of docks is also conducted at Puerto Cortés to maintain an acceptable
depth to accommodate the ships' draughts. Dredging was recently done and it is carried out
approximately every two years. TEXACO also has regularly carried out maintenance dredging in its dock
(dock nş 1). The last dredging exercise was executed during the year 2000 due to the siltation produced by
Hurricane Mitch.
Development of new infrastructure
Given the increase in the number and size of ships carrying cargo into Central America, each of the ports
has plans to expand to increase its capacity. Depending on the type of infrastructure, port expansion
efforts could have both direct and indirect environmental effects. The construction itself could directly
affect the local environment through clearing of land to make way for the infrastructure and improperly
carried out construction activities could affect water quality in the port's vicinity. Indirect environmental
impacts could result from the increased ship traffic, such as an increased risk of collisions and spills.
At Belize City Port discussions have been held regarding the development of a cruise ship terminal at Port
Loyola (Kings Head Pier) that would be operated by Port of Belize LTD.
August, 2003
77
Abt Associates Inc. / Woods Hole Group
Preliminary TDA
The owners of Big Creek have discussed expansion plans. The expansion would include deepening the
port basins and stretching (re-cutting) the access channel through the mangroves. .
According to the Municipality of Puerto Barrios, a Mexican company is interested in the construction of a
port equipped with state-of-the-art technology for the reception of oil-tanker ships (centralizing the export
and import of crude oil and other refined products).
Three additional plans for expansion have been considered for future development of Puerto Barrios:
further capital dredging, extension of the pier and expansion of warehouse area to accommodate more
containers. There are no immediate plans for further infrastructure development at this time, however.
The port maintains that EIAs are conducted for all projects. The Ministry of Environment and Natural
Resources, however, states that no EIAs have been presented to or approved by them.
Projects planned at Puerto Santo Tomás de Castilla include a bathymetric survey for the basins and
channel, post-Mitch dredging to increase the channel depth and an extension north of the port. Damage
caused by an earthquake also needs to be repaired.
At Puerto Cortés, the Enterprise AES has the approval of the national authorities to initiate the
construction of an electrical energy generation terminal (that will be located in barrio el Faro in Puerto
Cortés) based on liquefied gas. This project will use dock nş 1, which is currently used by TEXACO, for
import of the raw material. This dock is equipped with state-of-the-art technology. Additionally, areas of
the quay are being changed from general and liquid cargo to dry bulk. Post-Mitch dredging is planned. A
large extension project for the port is also planned. EIAs are done for all activities and approved by the
Secretaria Nacional del Ambiente (SENA).
5.1.2
Loading/Offloading and Storage of Cargo
During the loading and offloading of cargo from a ship, many opportunities for accidents arise. The
greatest risks occur with the handling of hazardous cargo, such as chemicals and petroleum products.
Miscommunications can happen or port workers can make careless errors that result in faulty pump
connections or variations in the rate of pumping causing spills to occur.
Puerto Santo Tomás de Castilla does not meet the minimum safety environmental standards within the
port-related industry. At the port the handling of hazardous cargo such as oil and chemical products is not
controlled; safety regulations are not mandated. Additionally, the quality and alignment of piping used
for transporting dangerous liquid cargo pose a high risk for accidents.
At Puerto Barrios, storage services have been concessioned by COBIGUA to two private stowage
companies in charge of cargo handling and storage. Approximately 90% of the cargo arrives to the port
stored in containers; the remaining 10% is composed of general cargo (mostly vehicles). Most of the
hazardous cargo that enters Guatemala through this port is containerized. Dangerous bulk goods (usually
stored in sacks or cans) are accepted only by direct transship. Hazardous cargo must be directly
discharged from the ship to the consignee. Texaco receives the only dangerous liquid cargo at the
terminal and there has not yet been a spill related to the discharge of Texaco's cargo. The port keeps a
copy of the International Maritime Dangerous Goods Code (IMDG) in order to handle the dangerous
goods as established by this code.
All ports have knowledge of IMO's IMDG and almost all of them have a one volume copy. Nonetheless,
at almost all of the ports, the handling and storage of these dangerous goods is done in an empirical way.
Generally, the employee with the highest seniority determines, based on his personal experience, the
appropriate storage and segregation method.
August, 2003
78
Abt Associates Inc. / Woods Hole Group
Preliminary TDA
5.1.3
Waste Generation and Handling
The handling of ship-generated and port-generated wastes, including ballast water, is one of the most
important port operational issues in terms of environmental protection faced in the Gulf of Honduras. As
is discussed above in Section 4, each of the three countries has ratified the MARPOL Convention. None
of these countries has yet put in place the regulations necessary to implement the Convention, however.
Nor do they have an adequate monitoring and enforcement system established in order to ensure
compliance.
Treatment and final disposal of the solid wastes generated on ship:
None of the ports in the Gulf of Honduras has adequate installations for the reception of solid wastes.
Belize City Port, Big Creek, Puerto Barrios and Puerto Santo Tomás de Castilla do not receive waste from
ships. In Puerto Cortés, Honduras, this service is given by the Municiapality.
Vessels are directed to not release any solid or liquid wastes in Belizean waters. The Environmental
Compliance Plan for Cruise Ships promulgated by the Government of Belize states that cruise ships must
submit the proper ships' documents certifying compliance with MARPOL's Solid Waste Management
and Separation Plan. This, however, does not mention whether it applies to other vessels operating in
Belizean waters.
National legislation forbids the reception of waste generated on ships in Guatemala. Additionally, Puerto
Barrios does not have a waste treatment plant that meets international regulations. Neither Puerto Barrios
nor Puerto Santo Tomás de Castilla accepts wastes and they do not carry out any inspections or control of
ship-generated wastes. As a result, there is a risk that ships jettison their wastes at sea.
At Puerto Cortés, wastes are not currently handled according to MARPOL. The municipality handles
waste discharge from ships, but there are no controls regulating the services. Through a written
application, any individual, or through a ship-owner agent, can request waste discharge services. This
petition must be signed by the chief of the environmental unit, by the municipality's public service unit
and by the Industrial Safety Department from Empresa Nacional Portuaria. Once the petition is signed, it
has to be presented to the municipal treasury with a fee, as established by the municipality's tax plan.
The wastes are then disposed of without any regulation in the municipality's uncontrolled landfill site.
The only requirement established by the local authorities is that the wastes should be domestic
(characterizing "domestic" type wastes as those generated from the time the ship begins on-board
operations until it reaches its final destination).
In Honduras, the Regional Office for Agriculture and Livestock Sanitation (belonging to the Agriculture
and Livestock International Sanitation's Organization) OIRSA, has a mandate from the President to
provide an unloading service for the wastes generated on-board. In order to facilitate the service, OIRSA
constructed an incinerator inside the port facilities in 1996, but the municipal authorities and OIRSA have
not yet reached agreement as to which authority has the right to provide this service. The incinerator does
not yet have an environmental license for operating. The municipality is concerned that significant
income would be lost if OIRSA remains in charge of providing the service (approximately $100/ship that
demands the discharge service). When the presidential mandate granted OIRSA the rights to provide the
service, Honduras had not yet ratified the MARPOL Convention.
Treatment and final disposal of the solid wastes generated by on land activities within the port
facilities:
August, 2003
79
Abt Associates Inc. / Woods Hole Group
Preliminary TDA
In Belize's ports, a crew is assigned to clean-up activities, which is supervised by the port authorities.
Big Creek and Belize City Port do not yet have incinerators and therefore do not adhere to MARPOL
standards. At Big Creek, waste oil from tug oil changes is re-used to lubricate the chains on the port's
cranes so there is no need to dispose of oil. A new latrine system with septic tanks was planned for the
port and the contents would be taken to a designated dumpsite. A boat collects garbage from the port and
monthly takes away debris (e.g., broken pallets) from the channel and nearby mangroves.
In Guatemala and in Honduras, this service is provided by the private sector through concession or an
auction process with contracts that last for one year. The wastes are deposited in each municipality's
landfill site. At present, the uncontrolled open air landfill sites are most commonly used for this purpose.
The construction of a controlled landfill site outside Puerto Cortés is currently underway. A private
enterprise provides clean-up services inside the facilities of Puerto Barrios (they clean the dock each time
a boat completes its operations).
Treatment and final disposal of the recovered products from an accidental spill:
There are concerns that some ports in the region do not have the capacity to ensure that recovered
products from accidental oil or chemical spills are adequately disposed of. Reports have been made that
some recovered products were illegally disposed of in municipal landfill sites, posing an environmental
risk.
Port operators at Big Creek are careful to avoid spills of oils or fuels, in large part out of concern for the
intake for the nearby shrimp farm that is located near the port. If oil is discovered in the creek, staff
investigates to find the source and prevent further leakage if necessary. Big Creek has no equipment to
clean-up oil spills and all vessel operators entering the port are warned of the need to avoid discharges of
fuel or oil.
Largely due to the types of products handled in its ports, Guatemala is the country with the most
registered accidental hydrocarbon spills. At the same time, Guatemala has a better coordinated
evacuation brigade in case of an accidental spill than any other country in the region. Although several
authorities participate in the recovery of spills, the company DVG is in charge of the treatment and final
disposal of the recovered product.
In Honduras, each company is responsible for developing its own preventive measures and cleanup plans
for addressing spills. If they lack capacity, it is the company's responsibility to request an assessment if
they face an accidental spill. The company then disposes of the recovered product according to its own
methods.
5.1.4
Ballast Water
The discharge of ballast water is a serious threat in the Gulf of Honduras, as it is worldwide. The
introduction of invasive marine species into new environments through ballast water and other shipping
vectors has been identified by the GEF as one of the four most serious threats to the world's oceans
(Global Ballast Water Management Programme, 2000). Invasive species threaten the survival of many
native freshwater, coastal and marine species and have proved to be economically devastating. To cite
one example, the introduction of the European Zebra Mussel into 40% of internal waterways in the
United States has required more than US$ 1 billion on control measures since 1989.
August, 2003
80
Abt Associates Inc. / Woods Hole Group
Preliminary TDA
Only three of the five main ports in the region accept sludge for treatment. None of the ports, however,
has non-oily ballast water discharge services. Although no statistics are available, the lack of ballast
water treatment facilities most likely results in ships regularly discharging untreated water into ports and
adjacent marine areas. This lack of ballast water treatment has been listed by stakeholders in the region
as the most serious environmental threat posed by port operations in the Gulf of Honduras.
There are no treatment facilities for oily-water or non oily-water in Belizean waters. The Belize City Port
receives little or no information regarding the dumping of oily-ballast or non-oily ballast in Belizean
waters due to the lack of resources to perform effective monitoring and compliance.
Ships docking at Puerto Santo Tomás de Castilla and Puerto Barrios in Guatemala have the option to use
the services of the company DVG to safely dispose of their oily ballast. According to DVG personnel,
the company takes sludge from approximately 80% of the ships docking at Puerto Santo Tomás de
Castilla. DVG has a treatment plant for the recovery and/or recycling of the oil product for its later
commercialization. Ships must pay a fee for this service, however. It is believed that some ships instead
choose to illegally dump their oily ballast several miles from the port where there is no enforcement.
At Puerto Cortés, the company Facilitadores Navieros, S.A handles the discharge of oily ballast.
Although Facilitadores Navieros of Honduras has an environmental license for its operation, the company
still lacks adequate treatment facilities and it is currently unknown where and how they dispose of the
final product.
5.1.5.
Port-Related Industry
Several of the ports have associated industries that also pose a threat to the sensitive ecosystems in the
vicinity. ZOLIC, located at Puerto Santo Tomás de Castilla is Guatemala's first free zone and has 39
registered companies dedicated to the manufacture of products such as liquor, cosmetics, foodstuffs,
chemicals and fertilizers. The enterprises that are located within the ZOLIC on the port facilities are
listed (including their storage capacity and stored products) in Appendix C. At Puerto Cortés, several
areas of the port are operated by private companies, such as oil and chemical companies. There is a
danger that spills or accidental discharges of hazardous substances could occur from these port-related
industries. Additionally, wastes are generated from these enterprises that must be handled.
Supporting data
Adequate monitoring data are not available that would allow the accurate analysis of the effects of port
operations on the surrounding environment. The most extensive testing conducted in the Gulf of
Honduras harbors was undertaken as a part of the environmental management cooperation program
between Puerto Cortés, ACDI and DDH. During their environmental analysis of the port, they found
elevated levels of heavy metals (As, Cr, Bu, Pb and Zn) accumulated in sediments within the port (DDH,
2002). This suggests that port operations have impacted the environment. Data provided by the National
Port Authority in 1992 for Santo Tomás de Castilla Bay showed high levels of contaminating nutrients
and fecal matter (from 750>25,000 NMP/DL) far exceeding the maximum permissible limit prescribed by
the Guatemalan Government for drinking water (3 NMP/DL) (Yańez-Arancibia et al., 1998).
Also necessary for the assessment of the environmental effects of port operations would be an accurate
record of spills and discharges into the port harbors. These records, unfortunately, are also not available.
The decision of whether or not to register an accident is up to the discretion of the port authority in each
country and is usually made based upon the magnitude of the mishap. It is known that accidental
contaminant discharges caused by shipping activities have taken place at all ports in the Gulf, but there is
August, 2003
81
Abt Associates Inc. / Woods Hole Group
Preliminary TDA
no comprehensive registry listing each of these accidents and the quantity and type of contaminant
released into the port.
Data on spills at Belize City Port were not available for this report. Big Creek does not record accidental
oil spills.
Guatemala registered 12 accidental spills between 1975 and 2002, most of which occurred in the port
facilities of Santo Tomás de Castilla:
·
August, 1997: Spill of lubricating oil
·
August, 1997: Spill of industrial primer, 2 tons
·
December, 1997: Spill of sludge, 200 gallons
·
May, 1999: Spill of sunflower oil
·
July 1999: Spill of combustibles
Puerto Barrios reported a spill of fuel oil and sludge that occurred as a result of a collision of a Chiquita
brands vessel with a pier in 1993. On February 27, 2003, a ship in the port spilled approximately 100
gallons of bunker as a result of the incorrect handling of valves in the machinery room. The port
coordinated with DVG to put out barriers and was able to confine the area of the spill in 25 minutes. The
bunker was picked up manually using absorbent material. The local spill brigade was informed of the
spill, but the port was able to handle the emergency.
Between 1994 and 2002, Puerto Cortés registered no oil spill accidents in its bay. Some accidents have
occurred, however, at the companie s installed adjacent to the port's facilities. For example, in August
1999, 150 gallons of bunker oil were spilled on the mainland by HONDUPETROL due to a perforated
pipeline. This incident was controlled by HONDUPETROL's personnel and as a result of this accident,
the company created an Environmental and Industrial Safety department. So far, HONDUPETROL has
invested in personnel training as well as in the acquisition of equipment and materials that are necessary
during an oil spill. At the end of 2002, approximately 49 gallons of bunker oil were spilled within a 15
m3 area during the discharge of a tanker consigned to HONDUPETROL. The area where the spill took
place was immediately confined by using containment barriers specially designed for the cleanup of
spills. Within 8 hours the spill was completely mitigated and no damages resulted. Texaco has caused
other environmental damages when receiving crude oil to be refined.
Sectors and stakeholders
Some of the main stakeholders include:
·
Port authorities
·
Port owners
·
Shipping companies
·
Municipalities
·
Port-related industries
August, 2003
82
Abt Associates Inc. / Woods Hole Group
Preliminary TDA
5.2
Negative Environmental Effects Arising from Marine Activities
5.2.1
Degradation Resulting from Oil and Chemical Discharge
5.2.1.1. Collision
The threat of oil and chemical spills resulting from navigational risks is quite serious in the Gulf
of Honduras. Due to the limited accessibility of Puerto Barrios and Puerto Santo Tomás de
Castilla in Guatemala within the inner section of the Bahía de Amatique, the risk of collisions and
groundings is significant. This risk is increased by the shallow depths and narrow width of the
navigational channels (on the average only 90 m wide and 11 m deep, while many ships reach
depths of up to 10.5 m). The sometimes extreme weather patterns in the region including
frequent hurricanes also threaten maritime safety. The age, type and maintenance of the ships
entering the Gulf of Honduras ports factor into the risk of accidents, as does the training of the
ship crewmembers. The need for impr oved navigational safety is widely recognized, including
better communication systems and infrastructure, as well as the capability to update bathymetric
maps.
Spills occurring in the Gulf, particularly in the Bahía de Amatique, have the potential to devastate
nearby sensitive habitats. One oceanographic current analysis carried out in the Bahía de
Amatique concluded that within 48 hours a major oil spill could spread along the shores of the
Bay and reach other areas of the Gulf, including the Honduran National Park of Jeanette Kawas.
The strong rotary currents of the Bay combined with its semi-closed and shallow nature make it
highly vulnerable to spills. The study also indicated that the Mesoamerican Barrier Reef could be
threatened by a spill in the Bahía de Amatique if the predominant winds were blowing in the
opposite direction of the currents (EPOMEX, 1993).
The risks of collisions or groundings occurring in the Gulf of Honduras are enhanced by the
following factors:
Inadequate navigational aids
Adequate and properly maintained navigational aids are critical elements of navigational safety,
particularly in areas such as the Bahía de Amatique where the navigational channels are
extremely shallow and narrow. There are concerns that the navigational aids in the Gulf of
Honduras are inadequate or improperly maintained and could enhance vessels' risk of collision.
Belize City Port's navigational aids consist of 24 buoys and beacons. There are also lighthouses
outside the delineated port boundaries. The buoys and beacons are of old technology and are
maintained by the Belize Port Authority on a limited budget. Increased funding would allow
these older systems to be phased out to be replaced with newer more maintenance-free units.
Big Creek's navigational aid system consists of buoys; twenty buoys mark the access channel
(Posford Duvivier, 1998).
The access channel that leads to the port facilities of Puerto Barrios and Santo Tomás de Castilla
in Guatemala is located in Bahía de Amatique. This channel, connected by sea buoys, has a depth
of 11 m, a length of 12 km and a width of 90 m. It has a navigational aids system type "B"
approved by the International Association of Lighthouse Authorities (IALA). The channel's
entrance has a sight land buoy, 8 buoys installed along the channel and an inland lighthouse. The
August, 2003
83
Abt Associates Inc. / Woods Hole Group
Preliminary TDA
sight land buoy indicates the entrance to the access channel; it is located at latitude 15ş 47.8' N
and longitude 88ş 36.2' W.
The system at Puerto Cortés operates through a major lighthouse with an elevation of 72 ft. The
lighthouse is in the form of a red and white metallic tower and can be seen from up to 20 nautical
miles. Four articulated buoys indicate the entrance as well as the exit channels existing in the
port, in accordance with IALA specifications. The port also has a "RONMARC" satellite station
and D.G.P.S. satellite stations, both of which are currently under repair. Volpe National
Transportation Systems Center trains port personnel to maintain this equipment. A study
conducted on the effects of Hurricane Mitch on ports in Honduras and Nicaragua made the
following recommendations for repairing and improving navigational aids at Puerto Cortés:
repair the lighthouse at Punta Caballos, repair the alignment markings and install a buoy one
nautical mile north of the entrance to the channel (USGS, 2000).
Bad weather
As is discussed above in Section 2.1.5, the Gulf of Honduras regularly experiences severe
weather patterns such as hurricanes and tropical storms. If ships do not have adequate warning to
allow them to escape the storm path, they risk being run aground on the coral reefs or shallow
sea-bottom in the Gulf.
Inadequate training and hydrographic capabilities
Seaman training is currently limited in the Gulf of Honduras. Inadequate training of seamen
increases the likelihood of collisions and groundings in the region. Additionally, seamen with
insufficient training are less prepared to handle cleanup of oil and chemical spills should they
occur.
The Maritime Defense Force of Belize has a basic skills programme for seamen training, but
there is no specialized training program. The Belize Port Authority is currently holding Port
Security Training, but this appears to be the first time that formal training has taken place in many
years. Training for oil spill response and hazmat is required for all relevant port personnel in
Belize, however.
The Atlantic Naval Base from Guatemala trains seamen in a basic skills programme. The port
safety and industrial security departments of Puerto Barrios train their personnel in first aid
issues, use of fire extinguishers, industrial security and emergency plans.
In Honduras seaman training is under the direction of the Merchant Marines. Seamen are taught
four basic courses: firefighting measures, survival techniques, first aid measures and social
responsibility (all recommended by IMO). The more highly experienced seamen also receive two
additional courses related to bridges and machinery. Puerto Cortés is completing an
Environmental, Industrial Hygiene and Security programme. A manual is also being prepared to
cover each department's needs.
None of these countries currently trains officers and ship masters. Puerto Cortés, in coordination
with the Merchant Marine's General Direction, recently founded the Seamen's Education Center.
Plans are being developed to expand the education center and make it the first specifically
dedicated to seamen training in Central America
August, 2003
84
Abt Associates Inc. / Woods Hole Group
Preliminary TDA
As part of this TDA preparation, the Mesoameric an and Caribbean Sea Hydrographic
Commission (MACHE) performed a gap analysis of hydrographic capabilities for the three
countries. They focused on institutional capacity, data gaps, marine survey capacity, electronic
chart development (ENC), and GIS/other product development. Table 5.2-1 sumamrizes these
gaps, whereas Table 5.2-2 provides more detail about the findings. This detailed review
demonstrates the significant gaps in the region regarding institutions, human and survey capacity,
and data availability.
Table 5.2-1. Hydrographic Component Gap Analysis Summary Findings
Belize
Guatemala
Honduras
mandates and policies
V
Institutional capacity
resources
V
V
V
organizations
V
coordination & collaboration
V
V
V
major ports
~
V
~
Data gaps
coastal areas
V
V
V
vessels
V
V
Survey technical equipment
V
V
V
capacity
skills
V
V
V
skills
V
V
V
ENC development
equipment
V
V
V
skills
V
V
V
Marine GIS/ Other
product development
equipment
V
V
V
~
partial gaps
V
major gaps
August, 2003
85
Abt Associates Inc. / Woods Hole Group
Preliminary TDA
Table 5.2-2. Hydrographic Component Gap Analysis -- Belize
Existing Capabilities
Needs
Institutional capacity
Data
Data acquisition
Product
Data
Product
(mandates, organizations,
availability,
development
acquisition
dev.
coordination, access, resources,
quality,
ability to perform and deliver,
accessibility,
etc.)
etc.
Data
capacity
Geog. focus
Institutional
Geog. focus
rsonnel
Technical
equipment
Personnel
proficiency
Technical
equipment
Personnel
proficiency
Pe
Personnel
Related initiatives
Technical
Technical
No affiliation with IHO or
Refer to No vessel
MACHC party to SOLAS,
Table 2.1
UNCLOS and MARPOL 73/78
No
Do not have Hydrographic
One
s needed
Port Authority and Ministry of
national or equipment
worker at
Natural Resources Environment
strategic
the
None
and Industry (MNREI) survey,
charting
MNREI
Inadequate
National level
suite needed
Port Authority maintains data;
plan
National level
Training needed
institutions conduct survey
Workstation
Hydrographic equipment
Personnel and training
work independently do not
share resources. No Current
Refer to No vessel
Requires a
effort to integrate through
Table 2.1
hydrographic
National hydrographic
No
survey to meet
commission
Data
Hydrographic
One
internatinal
available
equipment
worker at
standards
MNREI and Port rely on
digital
None
the
None
International Survey Division
phic commission to coordinate efforts amoung
Belize City
format some
MNREI
Inadequate
Belize Ctiy
suite needed
(HYCOOP) at the U.S Naval
data gaps
Training needed
Oceanographic Office for
exist
Workstations needed
Hydrographic equipment
Personnel and training
equipment, software and
technical assistance. Contract
Refer to
No vessel
Requires a
surveys provide data to port
Table 2.1
policy and mandates to allocate resources
hydrographic
authority
No
e
survey to meet
One
Limited
Hydrographic
internatinal
worker at
products
equipment
standards
the
None
needed
Big Creek
available
MNREI
Big Creek
No digital
Inadequat
Hydrographic
equipment suite
Training needed
data
Devlopment of National hydrogrra
Ministries and Internationally funded projects in Belize. Development of national
Personnel and training
Workstations needed
August, 2003
86
Abt Associates Inc. / Woods Hole Group
Preliminary TDA
Table 5.2-3. Hydrographic Component Gap Analysis -- Guatemala
Existing Capabilities
Needs
Institutional capacity
Data
Data acquisition
Product
Data
Product
(mandates, organizations,
availability,
development
acquisition
dev.
coordination, access, resources,
quality,
ability to perform and deliver,
accessibility,
initiatives
etc.)
etc.
Data
capacity
Geog. focus
Institutional
Geog. focus
Technical
equipment
Personnel
proficiency
Technical
equipment
Personnel
proficiency
Technical
Personnel
Technical
Personnel
Related
IHO member state and party to
Refer to Navy vessels
Four
SOLAS, UNCLOS and
Table 2.1
officers
MARPOL 73/78
No
Six
Do not have Hydrographic
sailors;
Navy and Port Authority
strategic
equipment
Four
survey, Port Authority
charting
workers at
None
maintains data; institutions
plan
Port
Inadequate
National level
National level
suite needed
conduct survey work
Training needed
independently do not share
Workstations needed
Hydrographic equipment
resources. Current effort to
integrate through National
Refer to Navy vessels
Four
Requires a
hydrographic commission
Table 2.1
officers
hydrographic
No
Six
survey to meet
Navy relies on International
Limited
Hydrographic
sailors;
e
internatinal
Survey Division (HYCOOP) at
products
equipment
Four
standards
the U.S Naval Oceanographic
available
workers at
None
None
Office; Port Authority has
No digital
Port
Inadequat
suite needed
Budget
Puerto Barrios
data
Puerto Barrios
Training needed
Workstations needed
Hydrographic equipment
Working with COCATRAM to
look for economic support
Refer to Navy vessels
Four
Requires a
within the European community
Table 2.1
officers
hydrographic
No
Six
survey to meet
Limited
Hydrographic
sailors;
internatinal
eeded
products
equipment
Four
standards
available
workers at
None
relationships in hydrography both natinally with links to the region
No digital
Port
Inadequate
suite needed
data
Continue work with National Hydrographic Commission to further working
Training n
Puerto Santo Tomas
Puerto Santo Tomas
Workstations needed
Hydrographic equipment
August, 2003
87
Abt Associates Inc. / Woods Hole Group
Preliminary TDA
Table 5.2-4. Hydrographic Component Gap Analysis -- Honduras
Existing Capabilities
Needs
Institutional capacity
Data
Data acquisition
Product
Data
Product
(mandates, organizations,
availability,
development
acquisition
dev.
coordination, access, resources,
quality,
ability to perform and deliver,
accessibility,
al
etc.)
etc.
Data
capacity
Geog. focus
Geog. focus
Technical
Institutional
equipment
Personnel
proficiency
Technical
equipment
Personnel
proficiency
Technic
Personnel
Technical
Personnel
Related initiatives
Associate IHO member state
Refer to No vessel
and party to SOLAS, UNCLOS
Table 2.1
Six
and MARPOL 73/78
No
workers
have a Hydrographic
from the
Port Authority collects,
national
equipment
Port
processes, disseminates
charting
hydrographic data
plan
None
veys; national and
no strategic
needed
Inadequate
Port Authority relies has a
National level
Six workers
charting
Planned surveys
National level
Training needed
budget but counts on
plan
Workstations needed
International Survey Division
Hydrographic equipment suite
(HYCOOP) at the U.S Naval
Oceanographic Office for
Refer to No vessel
equipment, software and
Table 2.1
technical assistance and the U.S
No
Six
National Imaging and Mapping
Data is Hydrographic
workers
Requires a
Agency (NIMA) for chart
available
equipment
from the
hydrographic
production
and in
Port
survey to meet
Digital
regional coordination
international
format
The National
standards
Port Authority
Data does relies on
None
not meet HYCOOP for
Inadequate
Six workers
Puerto Cortes
IHO
equipment and
Puerto Cortes
Training needed
standards for contracted vessel
Workstations needed
Harbors
time
Including hardware and software
Hydrographic equipment suite needed
Organizational policy and mandates need to be developed at the national level to
support capacity building, and resurce needs for hydrographic sur
August, 2003
88
Abt Associates Inc. / Woods Hole Group
Preliminary TDA
Table 5.2-5. Hydrographic Surveys and Data Availability in the Region
State
Port/Area
Source Data
Digital
Survey information/ Surveying needs
availability
coverage
Belize
Belize City Harbor
In-country
100%
Surveyed by Belize 1998, 2002 IHO
Big Creek
Unknown
Unknown
Order1 single beam and side scan sonar;
data gaps exist in Harbor area and strategic
charting plan needed for future port
infrastructure development and
navigational safety.
Puerto Barrios
In-country
0%
Inadequate coverage: most recent data from
Guatemala Puerto Santo Thomas
In-country
0%
1979.
de Castilla
All areas need to be re-surveyed
Bahia Manabique and
In-country
0%
approaches
Puerto Cortez
In-country
100%
Surveyed by Honduras (ENP) May 1998
Honduras
IHO order2, single beam and side scan
sonar; does not meet international
standards. Additionally dredging activity
and Hurricane Mitch have affected the
harbor area since last survey
Puerto Cortez
In-country
100%
Surveyed by Honduras (ENP) in June 1999
Ports, harbors and approaches
Approaches
IHO order2 single beam, does not meet
international standards.
Tela
In-country
0%
Needs to be re-surveyed
La Ceiba
In-country
100%
Being surveyed (ENP) IHO order unknown
Puerto Castia /
In-country
100%
Surveyed (ENP) IHO order unknown
Trujillo
Bay Islands
In-country
100% in
Coxen Hole, French Harbor Roatan
limited
surveyed by ENP 2002 IHO 2 single beam
areas
and side scan sonar.
Honduras
Coast-wide survey
In-country
0%
An 1984-85 survey carried out by the US.
(red band on fig 1.1)
Only some of the data could be used for
conversion into digital format.
Coastal
Surveys
Terrorism
Although small, the risk of a collision occurring in the Gulf of Honduras as a result of terrorist activities
does exist. There is a chance that a terrorist attack could be made on a ship in the Gulf, similar to the
attack that was made against the USS Cole in a Yemeni port in October 2000. Such risks have not been
evaluated fully at this time.
Traffic Intensity
The number and size of ships entering the ports of the Gulf of Honduras are increasing as trade expands
in the region. As the amount of ships moving through the Gulf of Honduras increases, so does the risk for
collisions and groundings. The number of ships using the Gulf of Honduras ports has dramatically
increased over the last decade and is expected continue to grow in the foreseeable future. For example,
the number of cruise ships using Belize City Port is expected to increase from 51 to 401 between 2001
and 2004.
August, 2003
89
Abt Associates Inc. / Woods Hole Group
Preliminary TDA
A factor increasing the risks of collision from the rise in traffic intensity is the lack of notification
provided by some ships. Not all ships entering ports in the Gulf of Honduras ports provide adequate
warning before their arrival. As a result, it is becoming more difficult to regulate the ships and the risk
for accidents increases. Because the ship channels are narrow, positive control and tracking of vessels
using the navigation channels are advisable. A Vessel Tracking System (VTS) would be advantageous
for these ports.
Inadequate vessel standards
Port inspectors are in charge of vessel supervis ion at each port. None of these inspectors, however,
assesses whether each ship arriving to the ports meets all safety standards established by the national
authorities and by the international organizations (such as the International Maritime Organization, or
IMO). The problems posed by the ships entering the ports of the Gulf of Honduras are similar to those
arising worldwide.
Presence of hazardous cargo
With the exception of Big Creek, hazardous cargo is regularly shipped in and out through the ports in the
Gulf of Honduras. Such products include oil and petroleum products and chemicals. The presence of
such cargo on board the ships navigating through the narrow channels, possibly during storm conditions,
increases the possible harm that could come from a collision in the Gulf waters. Appendix C contains
information on the amount and types of cargo handled by each of the ports.
According to the Belize Port Authority, fuel oil shipped into and within the region is the only dangerous
cargo. No hazardous cargo is shipped out of the Belize City Port. The Belize Port Authority recently
implemented a new form for the transportation of "Dangerous Goods", however, as the old form was not
up to international standards. These have been supplied to all the Shipping Agents.
Puerto Barrios does not have specific statistics for dangerous cargo since (except for Texaco's
hydrocarbons and liquid bulk) all hazardous cargo is transported inside containers, which are not emptied
in the port and are statistically considered to be containerized cargo.
No statistical data related to hazardous cargo is available for Puerto Cortés as the shipping companies
have only recently begun to inform the port about this cargo.
5.2.1.2 Vessel Discharge
As is discussed above in Section 5.1.3, three of the Gulf of Honduras ports accept sludge from ships, but
none of the ports treats non-oily ballast water. As a result, ships are forced to release their untreated
ballast water either before or after entering the port. Discharge of oily ballast can significantly affect the
environment through the release of such contaminants as heavy metals and petroleum. There is also a risk
that exotic species can be introduced into the sensitive Gulf of Honduras ecosystems, as has occurred with
the Mnemiopsis leidyi, or comb jelly, in the Black Sea and the European Zebra Mussel in the USA.
In extreme cases it could also be necessary for ships to discharge fuel or part of their cargo load before
entering the port. This could be necessary if, for instance, a hurricane or tropical storm was going to hit
the area.
5.2.1.3 Dispersant Usage
August, 2003
90
Abt Associates Inc. / Woods Hole Group
Preliminary TDA
A common component of oil spill response plans is the use of dispersants to respond to marine oil spills.
Dispersants are solvents or agents for reducing surface tension (surfactants like soap and detergent),
causing oil to enter the water column as fine droplets where it then disperses and a portion eventually
degrades with natural processes (water column and sediment transport; microbial degradation).
Dispersants are used to control movement of surface slicks into sensitive environments such as coral
reefs, mangroves, wetlands, etc.
Use of dispersants has been evaluated by a series of studies, including one exhaustive study by the Marine
Board of the Nationa l Research Council (NRC, 1989). This study reviewed the evidence for effectiveness
of dispersants, identified their positive and negative impacts, and provided recommendations for their use.
In their summary, they review situations where use of dispersants have proven effective, and others where
their use has proven to be less effective. Effective use mandates early treatment following the spill (at a
time when the oil spill is least viscous and most contained). Direct application of dispersants on marine
life (e.g., birds, manatees, etc.) is to be avoided, because they destroy water-repellency and insulating
capacity of fur and feathers, and some components may affect the structural integrity of sensitive
membranes and surfaces. Sublethal effects of dispersed oil may also occur to marine life, according to
laboratory studies. In general, marine organisms at the surface will be less affected by dispersed oil than
organisms in the water column. In shallow water, benthic organisms may be more affected by dispersed
oil. For most habitats such as mangroves, however, long-term effects are less and the habitat recovers
faster if the oil is dispersed before it reaches the area.
The NRC study suggested that sensitive inshore habitats such as salt marshes, coral reefs, sea grasses, and
mangroves are best protected by preventing oil from reaching them, and dispersion is one mechanism for
protection. NRC recommended further study, however, to establish those conditions under which
dispersants may harm certain ecotones rather than helping them.
NOAA has produced studies on oil spills in Coral Reefs and in Mangroves, focusing on planning and
response considerations. They discuss use of dispersed oil as one component of the planning and
response. For coral reefs, NOAA reiterated the NRC findings:
·
"Whenever an oil spill occurs in the general vicinity of a coral reef, dispersant use should be
considered to prevent floating oil from reaching the reef.
·
Dispersant-use decisions to treat oil already over a reef should take into account the type of oil and
the location of the reef.
·
Coral reefs with emergent portions are high-priority habitats for protection during oil spills.
·
The use of dispersants over shallow submergent reefs is generally not recommended, but the potential
impacts to the reef should be weighted against impacts that might occur from allowing the oil to come
ashore.
·
Dispersant use should be considered to treat oil over reefs in water depths greater than 10 m if the
alternative is to allow the oil to impact other sensitive habitats on shore.
·
Dispersal is not recommended to treat oil in reef habitats having low-water exchange rates (e.g.,
lagoons and atolls) if mechanical cleanup methods are possible."
·
In NOAA's guidance document on Oil Spills in Mangroves, Planning and Response Considerations
(2002), they consider that "If applied appropriately offshore, chemical dispersants can be an effective tool
for protecting mangrove forests and the habitat they provide. Tradeoffs among other resources at risk,
such as potential effects of high concentrations of oil in the water column on pelagic organisms and coral
August, 2003
91
Abt Associates Inc. / Woods Hole Group
Preliminary TDA
reefs, should be considered before dispersant use. When applied appropriately in sufficiently deep water,
impacts to corals are expected to be minima l."
In summary, recent experience and studies have shown that use of dispersants in areas such as the Gulf of
Honduras depends on many factors, including the sea conditions, the type of oil, the water depth, the
proximity to resource areas, the mix of organisms to be impacted and the time scale for response. An
effective oil spill planning and response plan should be based on detailed studies of the ecology, biology,
physical oceanography and geology of the Gulf of Honduras, including detailed modeling of the expected
dispersal patterns of dispersants. Templates should be prepared so response will consider these factors
appropriately immediately upon occurrence of a spill, and rapid and therefore effective dispersant use can
occur for those spills, conditions and habitats for which it is appropriate.
In the Gulf of Honduras, dispersants are available to the Guatemalen Navy for spill response. However,
dispersants have not been used to date in the region. The Navy has received some training in the use of
dispersants, should the need arise; however, there is no existing, effective decision tree governing use of
dispersants regionally, so dispersant impacts should be considered carefully before use.
5.2.2
Degradation Resulting from Other Marine Activitie s
5.2.2.1 Fishing
Overfishing and use of destructive fishing techniques are other marine activities that harm marine and
coastal ecosystems. Fishing in the region is conducted both artisanally and commercially, but it is not
governed by regional agreements and no national quotas have been established. Artisanal fish catch and
effort are not routinely reported to the government. Fish catch methods are not strongly enforced. For
Guatemala, the last study by the Food and Agricultural Organization of the United Nations appears to be
in 1986, nearly two decades ago. No UN/FAO reports were found for Honduras or Belize. Surveys of
artisanal fishermen were conducted by NGOs in the Gulf of Honduras in 1998 and 1999 to document the
status of the region's fisheries resources from their perspective. The fishermen noted a steady decline in
the fish stocks while at the same time the number of fishermen was increasing. They cited the main
causes of the decline to be overfishing, smuggling, the use of destructive gear and limited enforcement of
existing regulations (Heyman et al., 2000).
5.2.2.2 Anchoring
Small boats used for artisanal fisheries as well as for tourism and other uses commonly anchor to perform
their tasks. Such anchoring can damage coral reefs, disturb the vegetative community on the bottom and
destroy the benthos. In areas where such activities are frequent, such as popular diving spots, such
anchorage can disrupt the marine resources and cause damage. If left unaddressed, such anchorage
misuse can irretrievably reduce biodiversity and resource values. Unfortunately, no information or data
are available on this topic for the Gulf of Honduras.
5.2.2.3 Marine Collections
The Gulf of Honduras has many spectacular fish and marine organisms. Some of these are the objects of
marine collections for export purposes (primarily). If laws, regulations and enforcement are lacking, such
collections can result in economic and biodiversity loss to the region. Unfortunately, little information is
available on the extent of marine collection activities in the Gulf of Honduras, nor the legal and regulatory
basis for such activities.
5.2.3
Sensitive Area Mapping
August, 2003
92
Abt Associates Inc. / Woods Hole Group
Preliminary TDA
For this project, an ecosystem map was developed for the Gulf of Honduras and its watershed in order to
assess potential impacts from port, marine and other land-based sources of contamination (Figure 5.1-1).
The terrestrial ecosystems were taken from the Central America Ecosystems Map developed by CCAD
with support from the World Bank and the Netherlands (Vreugdenhil et al., 2002). This mapping system
followed a modified version of the UNESCO system of classification. Because this terrestrial mapping
system reached a level of complexity that was not necessary for the purposes of this project, the map
included in this Preliminary TDA is a simplified version of the terrestrial ecosystems defined in the
Central America Ecosystems Map.
The Central America Ecosystems Map did not, however, define such important marine and coastal
ecosystems as seagrass beds and coral reefs. For this project, the delineation of seagrass beds in the Gulf
of Honduras was taken from Yańez-Arancibia et al. (1994) and mapping done by WWF. The coral reef
delineations were taken from British Admiralty nautical charts of the region.
In order to examine potential threats posed by port, marine and land-based sources of pollution to coastal
and marine habitats, a sensitive vulnerable ecosystem map was developed for the marine and coastal areas
of the Gulf of Honduras (Figure 5.2-1). This map shows mangrove forests, seagrass beds, coral reefs and
protected areas in the Gulf as these were the habitats determined to be the most vulnerable to land and
sea-based contamination. To more specifically determine potential threats from port and marine shipping
operations, maps were developed for each of the major ports in the study area. The maps show sensitive
vulnerable ecosystems in the vicinity of the ports. Additionally, the maps show navigational channels and
currents in order to determine potential threats from marine spills.
Figure 5.2-1. Sensitive Areas in the Gulf of Honduras Particularly Vulnerable to Contamination from Oil
and Chemical Spills
(See Appendix D)
Big Creek2
The port of Big Creek is located in a sensitive area that is habitat for endangered species. As indicated on
Figure 5.2-2 the port and navigational channel are surrounded by mangroves. The Belize Coastal Zone
Management Project has recorded sitings of the endangered West Indian Manatee at the mouth of Big
Creek and in the adjacent Placencia Lagoon. Port staff stated in interviews that manatees are present in
the Big Creek channel at least as far upstream as the port (Posford Duvivier, 1998). Endangered turtle
nesting sites have also been recorded in the adjacent Placencia La goon.
2 The sensitive vulnerable areas adjacent to the Belize City Port have not been mapped as a part of the current study
because this area is located north of the boundary of the Gulf of Honduas.
August, 2003
93
Abt Associates Inc. / Woods Hole Group
Preliminary TDA
Figure 5.2-2. Sensitive Vulnerable Areas Adjacent to the Port of Big Creek
(See Appendix D)
In the port area are important fisheries resources. The near-shore coastal area to the south of Big Creek
was recorded in 1993 as a conch fishery. A reef fishery area is located approximately 10 km south of the
port. An extensive shrimp resource area runs parallel to the southern portion of Belize's coast and a
shrimp farm is located south of Big Creek. The water intake for the farm is located only a couple of
kilometers upstream of the port.
A large spill in the navigational channel could have a devastating effect on the nearby ecosystems and
fisheries resources. Due to the prevailing winds, the current runs north to south and spills within the
navigational channel would be pushed southwards rather than north towards the Placencia Lagoon.
Located to the south are seagrass beds, mangroves and significant fisheries resources. Additionally, a
spill within Big Creek could affect the upstream shrimp farm and the fringing mangroves.
Puerto Barrios and Puerto Santo Tomás de Castilla
Puerto Barrios and Puerto Santo Tomás de Castilla are located on the semi-enclosed Bay of Amatíque.
As has already been discussed above, a spill in this area could have an environmentally devastating effect.
One oceanographic current analysis carried out in the Bahía de Amatique concluded that within 48 hours
a major oil spill could spread along the shores of the Bay and reach other areas of the Gulf, including the
Honduran National Park of Jeanette Kawas. The study also indicated that the Mesoamerican Barrier Reef
could be threatened by a spill in the Bahía de Amatique if the predominant winds were blowing in the
opposite direction of the currents (EPOMEX, 1993).
Even a smaller more localized spill would affect important ecosystems. The Bahía de Amatique is the
"most important estuarine ecosystem in Guatemala because of its size, conservation state, ecological and
socioeconomical value as well as its great great ecotouristic potential" (Yańez-Arancibia et al., 1998).
Surrounding the ports are areas of mangroves and in the bay there is sparse seagrass (See Figure 5.2-3).
On land, a protected area is sited in the vicinity of the ports and there is significant potential for the
development of ecotourism in the area. The Bahía la Graciosa and Piteros River area has the most highly
developed mangrove forests in the region, as well as seagrass beds. The coastline from Punta de
Manabique to the mouth of the San Francisco River has beaches with fine even sand and good water
quality. The Punta de Manabique protected area serves as habitat for the endangered manatee and
provides habitat for fish and crustaceans.
Figure 5.2-3. Sensitive Vulnerable Areas Adjacent to Puerto Santo Tomás de Castilla and Puerto Barrios
(See Appendix D)
Puerto Cortés
Few sensitive vulnerable ecosystems are located immediately adjacent to Puerto Cortés (See Figure 5.2-
4); turtle nesting beaches may be the most sensitive use of these adjacent coastal resources. Nonetheless,
a spill has the potential to flow to other areas, including to the Jeanette Kawas National Park, one of the
largest protected areas in Honduras that is located east of the port. This national park includes lagoons,
estuaries, coral reefs and some of the best preserved mangrove forests on the Atlantic Coast. It is also
habitat for the following endangered and threatened species: six sea turtle species, five fish species, five
reptile species, tropical birds and twelve mammals. In the park, 374 species of marine species have been
recorded including 51 corals. The Río Motaqua Biological Reserve and Cayos Zapotillos National
Monument are also located in the vicinity of the port.
August, 2003
94
Abt Associates Inc. / Woods Hole Group
Preliminary TDA
Figure 5.2-4. Sensitive Vulnerable Areas Adjacent to Puerto Cortés
(See Appendix D)
Supporting data
Only one serious navigational accident has occurred in the Gulf of Honduras ports. On April 1, 1975, the
Shell barge Caribbean II was wrecked in the Bay of Amitíque. 40,000 gallons of asphalt and 58,390
gallons of fuel oil were spilled. The accident caused considerable damage to the bay.
At Belize City Port one serious collision occurred between a large cargo vessel and the Kings Head Pier.
Additionally, recently there has been a minor collision between a medium-sized cargo vessel and a
navigational aid.
Fortunately, no other serious accidents have been recorded in the Gulf. The potential exists for one,
however, especially given the amount of hazardous cargo that is transported in and out of the Gulf of
Honduras.
Sectors and stakeholders
Some of the main stakeholders include:
·
Port authorities
·
Shipping companies
·
Merchant Marine
·
Navy
·
Port-related industry
·
IMO
·
COCATRAM
·
Port owners
August, 2003
95
Abt Associates Inc. / Woods Hole Group
Preliminary TDA
5.3
Other Land-Based Activities (other than shipping-related) Causing degradation of the
ecosystems of the Gulf of Honduras
The sensitive habitats of the Gulf of Honduras are being negatively affected by a variety of land-based
activities other than port and shipping-related operations (See Figure 5.3-1 for a delineation of land uses
in the Gulf of Honduras). Solid waste and urban, agricultural and industrial run-off, all contribute to the
degradation of the coastal and marine ecosystems of the region.
Figure 5.3-1 Land Use in the Gulf of Honduras
(See Appendix D)
Below the six industries, other than maritime transport-related, identified as having the greatest impact on
the Gulf of Honduras environment are discussed. These sections provide only a summary of information
available on the different sectors and their environmental impacts, however. In many areas data were
lacking.
Assessing the effects of these land-based sources of contamination on the Gulf of Honduras is difficult as
little water or sediment quality monitoring has been done in the region. In the case of Belize, it has only
been in recent years that environmental monitoring has become a national priority. Prior to that, the
country's low population density, richness of natural resources and limited industrial development kept
interest in environmental management low (Lee et al,. 1996). In Guatemala and Honduras attention until
recently has been focused on achieving political stability and developing the economy. As in other
developing countries, environmental protection historically has taken a backseat to competing interests
and little emphasis has been placed on environmental monitoring. Thus, a complete and accurate
assessment of the effects of contamination resulting from land-based sources in the Gulf of Honduras
region is not possible at this time.
5.3.1 Agriculture
Agriculture has been identified as the greatest land-based source of pollution in the Gulf of Honduras
watershed. Subsistence and large-scale agriculture are significant economic activities in the region, and
the industry is the largest employer in the watershed. Agriculture affects the marine and coastal
environment in several ways. First, increased runoff resulting from clearing of land to make way for
cultivation adds to the sedimentation of the waterways, reducing productivity in coastal waters and
smothering corals. As the region's population continues to grow, more land will be needed to sustain it
and deforestation will continue to occur. Second, the chemicals used in agriculture are harmful to the
aquatic environment. In coffee and banana production, intensive methods are used that include fertilizers
and other chemicals that runoff and flow into waterbodies, causing nutrification of the coastal waters.
Nutrients promote the growth of phytoplankton, which inhibits seagrass and coral photosynthesis and
promotes algal overgrowth of reefs. Pesticides and herbicides have potentially harmful effects on marine
organisms. Third, solid waste resulting from intensive agricultural practices is carried into coastal waters
from the upper watersheds and harms the sensitive ecosystem.
In Belize, the main crops planted are bananas, citrus, corn, rice, cassavas, mangoes and cocoa. Large
tracts of land have been cleared to make way for cultivation.nnAlthough agricultural production in the
region is moving towards permanent subsistence farming, the slash and burn methods used by the Maya
Indians still persists in the Toledo District. Roughly 22% of the national rice crop is produced in the
southern region of Belize, 60% from milpa production (IADB, 2000). Citrus and bananas are grown on
plantations; however, these Milpa farmers continue to make up 80% of the farming community (DHV
Consultants, 1994). Citrus is grown on 7,000 ha and is transported to processing plants where it is
processed for export (DHV Consultants, 1994).
August, 2003
96
Abt Associates Inc. / Woods Hole Group
Preliminary TDA
Agriculture in the Toledo and Stann Creek Districts of Belize poses a particular threat as many areas in
the region are highly prone to erosion. Areas of concern include the steeper slopes of the Maya Mountain
foothills which are farmed by Milpa farmers and the marginal Puletan soils on the coastal plains which
are farmed by citrus farmers (DHV Consultants, 1994).
Another problem associated with agriculture in southern Belize is the use of agro-chemicals. Although
specific numbers were not available, researchers found that small farmers in the southern region of Belize
use amounts of pesticides, insecticides and herbicides that are too high and that the situation is more
dangerous than is generally believed (DHV Consultants, 1994). Overall, it was estimated that in 1994 the
total amount of fertilizers used was 270 kg/acre (UNEP, 1999).
On large banana plantations, fertilizers, fungicides and nematicides are regularly used. It has been
estimated that a total of 284 lbs. N, 72 lbs. P202 and 636 lbs. K2O are required to produce 30 tons/ha (12
tons/acre) of bananas (Oschatz in Holder et al., 1999). To combat the Black Sigatoka Fungus banana
farmers have been conducting aerial spraying of several types of fungicides, including the hazardous Tilt,
Sico, Benlate, Vandozeb, Dithane, Manzate, Calixin and Bravo (Ariola et al., 1999). Water samples from
three rivers in southern Belize watersheds where bananas are grown at low flows did not show any
elevated levels of minerals, with the exception of ammonium levels that were slightly above the normal
range, however (Holder et al., 1999). Additionally, studies analyzing fungicides and nematicides in
waterways and accumulating in the environment did not detect the chemicals, however (Holder et al.,
1999)
The citrus industry in southern Belize also uses pesticides, including Malathion and Temic (Ariola et al.,
1999). Malathion is typically used to control the proliferation of the Mediterranean and Mexican fruit fly.
The broad-spectrum pesticide Temic is used to control nematodes, aphids and other insects on citrus
farms. Other hazardous agrochemicals in use in the region are the herbicides Paraquat, Glyphosae,
Roundup and 2-4D. These chemicals are easily leached into the waterways and are introduced by the
rinsing of spray pumps in streams adjacent to farms.
Table 5.3-1. Estimate of Nitrate and Phosphate Loads into Surface Waters by Banana and Citrus Production
in the District of Stann Creek, Belize1994
Agricultural
Phosphates
Phosphates
Nitrate
Nitrate
Production
Area ha
Loads
Loads
Loads
Loads
(tons/year)
(%)
(tons/year)
(%)
Banana
1,960
64
65
520
48
Citrus
6,975
35
35
488
52
Total
8,935
99
100
1,008
100
Source: World Bank, Belize Environmental Report (1996)
Livestock production in southern Belize is another contributor to environmental degradation in the
watershed, although the herds are relatively small in part due to competition over grazing lands with
citrus plantations. In 1994, the region produced only 4% of the national cattle population. The region is
also home to approximately 25% of the national swine population (IADB, 2000).
Another problem identified with agricultural production in southern Belize is waste plastic from banana
cultivation. The waste is sometimes washed downstream and it accumulates in coastal areas.
Agriculture is the activity that has had the most significant impact on the loss of woodlands, mangroves
and marshes in the Gulf of Honduras region of Guatemala, even though the soils are not well suited to
August, 2003
97
Abt Associates Inc. / Woods Hole Group
Preliminary TDA
crop production. Slash and burn methods are commonly used in the region without any consideration for
conservation. Herding is a complementary activity.
Coffee and bananas are probably the most significant crops grown in the watershed. In 1999-2000,
roughly 230,000 ha were used for coffee cultivation (MAGA, 2001). Other crops grown in the wateshed
include rice, black beans, corn, red beans, sorghum and sugarcane. Information was not available on the
amount of pesticides used in the Guatemalan portion of the watershed.
Agriculture, the largest sector of the national economy, plays an important role in the Honduran portion of
the Gulf of Honduras watershed. Major crops planted include banana and coffee. Large areas are also
used for the cultivation of sugarcane and African palm. Other crops include corn, rice, beans, onions,
potatoes, plantains and oranges. As in other areas of Central America, Honduras relies on an excessive
use of biocides, in part due to lack of awareness in the farming communities. A total of 1,726,350 kg of
insecticides and nematocides and 1,186,630 kg of herbicides were imported into Honduras in one year
(UNEP 1999). There is no reliable data on how serious an environmental threat this agro-chemical use
poses to the Gulf of Honduras, however.
Table 5.3-2 summarizes some of the regional characteristics for agricultural wastes and inputs to the
environment.
Table 5.3-2. Agricultural Wastes and Inputs to the Environment
BELIZE
GUATEMALA
HONDURAS
2400 HA Banana
Total HA in Agriculture
7000 HA Citrus
668,600
340,000
Annual % increase in
agricultural land
Annual fertilizer use
600 kg/HA
Annual agro-chemical
use (tons)
3,000
5.3.2
Logging
Forestry, as well as deforestation occurring to make way for expanding agricultural production, has
caused the degradation of coastal waters. Much of the deforestation has occurred in the upper watersheds
where the potential for erosion is high. Mangroves along the coast have also been cut, however, thereby
directly destroying important habitats. The removal of tree cover causes soil erosion and the ensuing
sedimentation of rivers and sea beds. Nutrients are released causing the degradation of waters and
damage to corals and sea grass. Seagrass beds are also affected by the changes in water transparency
indirectly caused by logging.
Belizean forests have been logged since the 1700s. It was recently determined that only 14% of the
forests of Belize were suitable for timber production and in the past few years the forest industry
contributed roughly 3% to the GDP annually (Ministry of Natural Resources, Environment, and Industry,
2002). Primary species sought by woodcutters include Mahogany (Swietenia macrophylla), Pinewood
(Pinus caribaea), Rosewood and Logwood (Haematoxylon campechianum) (DHV Consultants, 1994).
Seventy-five percent of southern Belize is covered in broadleaf forest, pine forest, broken ridge, and other
natural vegetation habitats and the region has eight forest reserves. In recent years, logging in Stann
August, 2003
98
Abt Associates Inc. / Woods Hole Group
Preliminary TDA
Creek has declined, including in mahogany and other hardwoods, indicating that these resources are
diminishing. The logging industry in the Toledo District is still strong, dominated by harvests from
government lands. There is a perception that this area remains a good source of hardwoods, but estimates
of remaining timber sources may be overstated (IADB, 2000). Seventeen licenses have been issued for
logging in the region and the logging industry employs 218 persons full-time. In 1998, lumber
production was reported at 494,171 cu ft of log timber, and 2,012 cu ft of pine holes, but actual
production is estimated to be roughly 50% higher than what is reported (IADB, 2000).
Deforestation is currently occurring at a rate of approximately 5,000 ha/year in southern Belize
(Meerman, 1999). It has been determined that between 1989 and 1994, 78,076 ha were deforested, and
that 9% or 6,682 ha of this total cleared was inside protected areas (Belize Ministry of Natural Resources,
1998). Nonetheless, approximately 65% of the country remains under closed forest cover and most
mangrove forests are still relatively pristine. While no logging is permitted in National Parks, logging
concessions are awarded in Forest Reserves.
Logging is a major industry in Guatemala and a significant contributor to deforestation. Nationally,
forests have been declining at a rate of approximately 90,000 ha annually, as trees are cut for construction
materials and firewood (UNEP, 1999). Satellite imagery from 1998-99 showed that 45.4%, or 49,300
km2 of the country was forested, .4% of which was mangroves (UNDP, 2002). Mangroves are being cut
rapidly, however. Between 1992 and 1998, the mangrove coverage in Guatemala decreased by 29%
(CONAP et al., 2001).
Forestry is common on the Atlantic Coast and is not subjected to any form of sustainable management.
Significant destruction of the tropical forest in the Sarstoon River's upper watershed has been observed
where the forests have been substituted for cattle pasture. The felling and burning of trees has been
linked to sedimentation of the Sarstoon River.
Forestry is an important activity in Honduras. According to some sources, Honduras has the potential to
become the largest producer of timber and non-timber forest products in Central America, particularly in
the northern and eastern regions of the country (Salazar, 1997). Pine, mahogany, ebony, walnut and
rosewood are the most valuable woods and logging of these trees has resulted in deforestation.
Originally, 87.7% of the country's 112,492 km2 was covered in forest (Salazar, 1997), but between 1965
and 2001, the amount of forested land in Honduras decreased by 23%. The State Forestry Commission
reported in 2001 that nationally, 1,652,200 hectares were deforested, 3,607,400 hectares were used for
agriculture and livestock, 559,100 hectares were covered in mixed forests, 2,512,700 hectares were
covered in pine forests, and 2,917,800 were broad-leaved forests.
Table 5.3-3 summarizes the logging activities in the Gulf of Honduras region.
Table 5.3-3. Logging Activity
BELIZE
GUATEMALA
HONDURAS
Total area of forests
(HA)
3,600,000 (nationally)
5,989,600 (nationally)
Annual logging
intensity (HA)
5,000 (southern Belize)
82,000
Area of Mangroves
54,300 (4,500 in the
(HA)
40,000
16,765
project area)
August, 2003
99
Abt Associates Inc. / Woods Hole Group
Preliminary TDA
Annual loss of
mangroves (HA)
3,000 (nationally)
5.3.3
Municipal Sewage Discharge
One of the most significant sources of contamination in the region is untreated wastewater. Virtually all
of the cities in the three countries bordering the Gulf of Honduras lack any or an adequate sewerage
system, causing the discharge of untreated wastewaters either directly into the sea or indirectly via rivers.
Since the population living in the watershed is quite large, the amount of raw sewage entering the Gulf is
substantial. The effects of this discharge include the reduction of water and ecosystem quality and
changes in transparency and light penetration that could affect photosynthesis processes and the
productivity of phytoplankton and seagrass.
Access to sanitation facilities is extremely low in the Stann Creek and Toledo Districts of Belize. This
has led to contamination of groundwater and the occurrence of human health problems such as
gastroenteritis and hepatitis. No areas of the Stann Creek and Toledo Districts have access to sewerage
systems (Belize Central Statistical Office, 2000).
Table 5.3-4. Sanitation Coverage by District in Southern Belize, 1994
District
Percent Urban
Percent Rural
Stann Creek
18
19
Toledo
33
24
Source: WASA and RWSSP Report, 1994
One of the most significant threats to the Gulf from Guatemala is the lack of a sewage disposal system,
drainage and sewage treatment plants in the coastal area towns of Puerto Barrios, Puerto de Santo Tomás
de Castilla and Livingston, as well as in the small villages and towns in the area.
Sewage is also a problem on the Honduras coast, as is solid waste. In urban areas, it is noted that 61% of
the population is covered by a sewer system, while only 7.8% is covered in the rural areas (UNEP, 1999).
The Chamelecón River is contaminated by untreated liquid and solid wastes run-off produced by the
major cities of San Pedro Sula and Puerto Cortés, causing health problems and damage to the coastal
ecosystems. It was estimated in 1989 that 64% of the total solid waste generated in Honduras (923
tons/day) was handled by individuals, which was commonly dumped in nearby vacant lots (UNEP, 1999).
5.3.4
Aquaculture
Aquaculture is another source of degradatio n of the sensitive habitats and species of the region.
Aquaculture has the potential to harm coastal and marine ecosystems in several ways. Pond effluent
consisting mainly of nutrients threatens the health of coral reefs and seagrass beds. There is also a
possibility that the farmed shrimp will pose a threat to native shrimp. Shrimp farming is also a concern as
there is a potential that sensitive mangrove habitats will be destroyed in order to make way for the farms
and chemicals are used in the production of shrimp. So far, the farms in southern Belize have used the
existing mangroves as a filtering system, and have left them intact. But if the farms expand, there is a
potential they will be destroyed (CZMAI).
Aquaculture, primarily of shrimp, is an expanding economic activity in the Belize portion of the
watershed. Approximately 40 % of Belize's total production facilities of this industry are located in the
southern region of the country. These 8 farms include approximately 30,000 acres of land-holdings,
roughly 9,500 acres of which are potentially suitable for production use. Prior to 1999, roughly 1,069
August, 2003
100
Abt Associates Inc. / Woods Hole Group
Preliminary TDA
acres had been placed into shrimp production, and another 1,000 acres were planned for construction and
production of shrimp during 1999 (IADB, 2000).
Fertilizer (consisting mainly of urea, sodium nitrate, ammonium nitrate triple superphosphate and
diammonium phosphate) is applied to ponds to increase nutrient concentrations at a rate of approximately
348 lbs/acre/wk (Belize Central Statistical Office, 2000). White lime is also used to control algal
production in ponds and to control disease. Most of the shrimp farms dump the waste from the ponds into
the nearby mangroves, hoping that the excess nutrients will be absorbed by the ecosystem. Little
monitoring or research on carrying capacities has been done, however, and this practice has the potential
to be devastating to the mangroves (Gladden Spit Marine Reserve).
Table 5.3-5. Parameters Monitored by the Shrimp Mariculture Industry in Southern Belize, 1998
Intake
Effluent
Inputs
Seawater
Farm
Source
Volume
Treated /
Feed
Fertilizer
White Lime
(mil gals/ day)
Monitored
(`000 lbs/yr)
(lbs/acre/week)
(`000 lbs/yr)
Nova Toledo
Sea
16.3
Yes/Yes
1,600
60
246
Nova Laguna Madre
Lagoon
0.1
Yes/Yes
600
60
28
Belize Aquaculture
Sea
0.2
Yes/Yes
455
N/A
1
Ltd.
Toledo Fish Farm
Sea
12.0
No/No
317
3
152
Source: Belize Central Statistical Office
Aquaculture is not carried out on the Atlantic coast of Guatemala and Honduras.
5.3.5
Tourism
Increased tourism and its associated coastal development also affect habitats in the Gulf of Honduras
region. Mangroves and coastal littoral forests have been destroyed to make way for hotels and other
tourism infrastructure. This clearing of vegetation and dredging increases sedimentation of the coastal
waters. Untreated sewage and wastewater from these new developments cause nutrification and
decreases vegetation. Garbage disposal from tourist boats and coastal development is often inadequate
resulting in solid waste entering waterways and further decreasing water quality.
The increase in population and the tourism in Belize (due to the beauty of its coral reefs) has promoted
the conversion of the natural coasts into ports, tourist beaches and new settlements, whereby the felling of
mangroves and destruction of other natural areas has reduced the breeding places for marine species as
well as the nursery for plant aquatic species.
As development in the coastal zone continues, spurred on by increasing tourism, marine dredging is an
activity that is occurring in the coastal zone of Belize. Since the Belize coast and cayes are low-lying,
development in these areas frequently requires that nearby areas be dredged in order to provide fill
material. This activity both directly destroys the seabed and causes the suspension of sediments which
reduces light penetration, smothers seagrass and corals and releases contamination (CZAI, State of the
Coast Report 1999).
Although tourism is the second largest foreign exchange earner in Guatemala, the industry is not well
developed along the Atlantic Coast. Coastal tourism in the region remains largely domestic and tourism
infrastructure and services are not ample. Nonetheless, the tourism industry is negatively affecting the
Bahía de Amatique as wastewater generated by hotels and boats anchoring in Golfete is discharged into
the marine area without treatment (Yańez-Arancibia et al., 1998).
August, 2003
101
Abt Associates Inc. / Woods Hole Group
Preliminary TDA
Information was not available on the effects of tourism on the Honduran area of the Gulf of Honduras.
5.3.6
Industrial Discharge
Industrial development in the watershed is another factor causing degradation of the vulnerable
ecosystems of the Gulf of Honduras. A number of large manufacturing centers, such as San Pedro Sula in
Honduras and Guatemala City, are located in the watershed with agro-processing, textile and chemical
industries. Laws regulating industrial effluent are new and enforcement is lax. Additionally, the
infrastructure does not exist to adequately handle industrial waste and wastewater. As a result, the Gulf
has been contaminated with chemicals, heavy metals and petroleum products.
Belize has no heavy industry and has thereby largely remained free of industrial contamination. The
citrus industry in the southern region of the country has contaminated the Stann Creek to a certain extent,
however. Citrus processing typically results in large volumes of effluents being released into nearby
streams, but the largest citrus processing plant has recently installed a treatment system of anaerobic
settlement lagoons (Ministry of Natural Resources, Environment, and Industry, 2002).
Oil exploration is being considered for Lake Izabal in Guatemala and could seriously degrade water
quality and habitats if preventive measures are not taken. Oil exploration could also negatively affect the
surrounding Río Dulce and the marine/coastal zone due to chronic release or accidental spills, or also by
the interruption of natural run-off as a result of the development of canal and access routes. Additionally,
activities such as oil drilling cause an influx of population and associated infrastructure that could further
degrade the environment as demand for services such as drinking water, solid waste disposal and sewage
increases.
Forty-six percent of Honduras's industry is located in Cortés province on the Gulf of Honduras. Very
few industries treat their liquid, solid or atmospheric waste. Data are not available on the extent of
contamination from industries in the region, however.
Table 5.3-6 lists the major industries in the Gulf of Honduras region.
August, 2003
102
Abt Associates Inc. / Woods Hole Group
Preliminary TDA
Table 5.3-6. Major Industries (Excluding Those Associated with Ports)
INDUSTRY
BELIZE
GUATEMALA
HONDURAS
Oil exploration
3.4 million barrels per
(onshore)
year
Oil exploration (marine)
Hydrocarbon refinement
Chemical processing
v
Tanning industry
Lumber Industry
v
Mining industry
Ni, Pb, Fe, Zn, Au, Aq
Pb, Zn
Sugar processing
v
v
Clothing and textiles
v
v
Supporting data
As part of this TDA preparation, estimates were made of the potential inputs of nutrients and
Carbonaceous Biochemical Oxygen Demand (CBOD) into the Gulf of Honduras.
Land Based Contamination
In this section an estimate of the potential land based contamination from point sources (industries,
municipal wastewater, solid waste) and nonpoint sources such as agricultural and urban runoff is
presented. Table 5.3-7 presents a summary of the results by source of this analysis. The analysed sources
were industrial contamination, domestic wastewater, agriculture including animal waste. Figures 5.3-2,
5.3-3, y 5.3-4 show the total potential loads for BOD, and nutrients.
The estimates were calculated base a methodology using loading factors which is described below: The
information from provinces, municipal units, or other administrative unit were aggregated by watershed
using GIS.
The contaminant loads are "potential" loads discharged to the environment which can reach water bodies
and have been estimated using loading factor from the literature. Estimation of the actual loads reaching
the streams, river and the gulf can only be obtained after implementing monitoring programs with
mathematical models to determine the loads at different points within the watershed or at their outlets at
the gulf. Sources used to estimate these loads were:
·
Population by watershed
·
Digital maps of watersheds, provinces, districts, and agricultural regions.
·
Land Use Land cover provided by USAID-PROARCA
August, 2003
103
Abt Associates Inc. / Woods Hole Group
Preliminary TDA
·
Inventory of Animals (cattle, swine, fowl).
·
Inventory of Industries for Guatemala ("Directorio Nacional de Empresas y sus Locales-Instituto
Nacional de Estadísticas del Banco de Guatemala") and for Honduras a list provided by the
Secretariat of Comerse and Industry with special export considerations.
·
Potential loads were estimated as follows:
Municipal Wastewaters BOD loads were estimated assuming a daily consumption of 180
liters/day/person for population with water supply assuming concentrations of 300 mg/L of BOD, 30mg/l
of Total nitrogen, and 6 mg/l of phosphorus.
Solid waste An average of 1kg of daily waste was assumed per person of which 50% could potentially
reach the water bodies y areas with no proper disposal
Urban runoff With the land use information on urban areas the followin g loading factors were used to
estimate nutirient loads exported from urban areas: DBO=90kg/ha/year, TN=11.4kg/ha/year, and
TP=3.4kg/ha/year.
Industrial loads BOD loads were estimated using a meted developed by the World Bank. This
method, is based on emisión sources based on the economic activity of the industry (Industrial Pollution
Projection System, IPPS). The methos was developed based on US data for each industry activity
(employment, production) and their emissions for each contaminant in order to obtain intensity factors for
contamination for each industrial activity unit.
This method has been applied to many countries and has been adequate to determine priorities in terms of
industrial contamination. In this application, the method is used to estimate BOD loads. The methods
could also be applied to estimate contaminants loads for other 10 categories to air, water and soil. Table
5.3-7 presents de estimated loads for BOD
Animal Waste Inventories of animals (cattle, swine, chickens, etc.) were assigned by watershed using
the following potential pollution loads per animal. beef: 0.7kg/BOD/day, milk: 0.77kg/BOD/day, swine:
0.12 kg/BOD/day, y fowl 0.006kg/BOD/day. Nutrient content in the waste of animals were assigned to
animal wastes in relation to a standard weight of 454Kg. The factors used were: 0.15kg/TN/day, milk:
0.20kg/TN/day, swine: 0.24 kg/TN/day, and fowl 0.5kg/TN/day, and for total phosphorus:
0.942kg/TP/day, milk: 0.043kg/TP/day, swine: 0.082kg/TP/day, and fowl 0.136kg/TP/day.
Assumed average weights for animals were cattle: 281kg, swine 94kg, fowl 0.9 kg. It is assumed that
only 25% of the produced nutrients reach a water body due to volatilization and other factors.
Agriculture - Loads from agriculture activities were estimated for nitrogen and phosphorus using the
land use information and applying the following loading factor for potential contaminant loads: Nitrogen
30Kg-TN/ha/year and for phosphorus 2.5Kg-TP/ha/year.
Other (Non agriculture)- Other non-agricultural land uses discharge nutrients to the environment. The
loading factor assumed for these uses are: Nitrogen-3Kg-TN/ha/year and phosphorus 0.4Kg-TP/ha/year.
August, 2003
104
Abt Associates Inc. / Woods Hole Group
Preliminary TDA
Table 5.3-7. BOD, Nitrogen and Phosphorus Potential Loads to the Gulf of Honduras
Watershed
BOD (kg/day)
Nitrogen(Kg/day)
Phosphorus (kg/day)
Chamelecón
Wastewater
30,640
3,064
613
Industrial discharges
5,904
ND
ND
Solid waste
14,469
851
284
Urban Runoff
1,894
240
72
Agriculture
0
11,387
949
Animal Waste
30,483
4,276
1,236
Other (Pasture, Forest)
0
2,269
302
Total-Chamelecon
83,391
22,087
3,455
Ulua
Wastewater
194,088
19,409
3,882
Industrial discharges
7,914
ND
ND
Solid waste
91,653
5,391
1,797
Urban Runoff
1,045
132
39
Agriculture
NA
45,329
3,777
Animal Waste
273,705
8,517
2,432
Other (Pasture, Forest)
NA
13,588
1,812
Total-Ulua
568,405
92,367
13,740
Sarstun
Wastewater
16,110
1,611
322
Industrial discharges
776
ND
ND
Solid waste
7,608
448
149
Urban Runoff
0
0
0
Agriculture
NA
3,679
307
Animal Waste
1,234
184
57
Other (Pasture, Forest)
NA
1,406
188
Total-Sarstun
25,727
7,329
1,022
Motagua
Wastewater
344,895
34,490
6,898
Industrial discharges
59,878
ND
ND
Solid waste
162,867
9,580
3,193
Urban Runoff
3,005
381
114
Agriculture
NA
28,804
2,400
Animal Waste
46,401
10,183
2,255
Other (Pasture, Forest)
NA
11,517
1,536
Total-Chamelecon
617,046
94,955
16,396
August, 2003
105
Abt Associates Inc. / Woods Hole Group
Preliminary TDA
Watershed
BOD (kg/day)
Nitrogen(Kg/day)
Phosphorus (kg/day)
Izabal-Rio Dulce
Wastewater
51,280
5,128
1,026
Industrial discharges
1,409
ND
ND
Solid waste
24,216
1,424
475
Urban Runoff
261
33
10
Agriculture
NA
18,789
1,566
Animal Waste
5,005
624
185
Other (Pasture, Forest)
NA
4,688
625
Total-Izabal-Rio Dulce
82,171
30,687
3,886
Belice Watersheds
Wastewater
23,412
2,341
468
Industrial discharges
150
ND
ND
Solid waste
11,056
650
217
Urban Runoff
131
17
5
Agriculture
NA
2,438
203
Animal Waste
677
120
37
Other (Pasture, Forest)
NA
3,658
488
Total-Belize Watershed
35,425
9,225
1,418
August, 2003
106
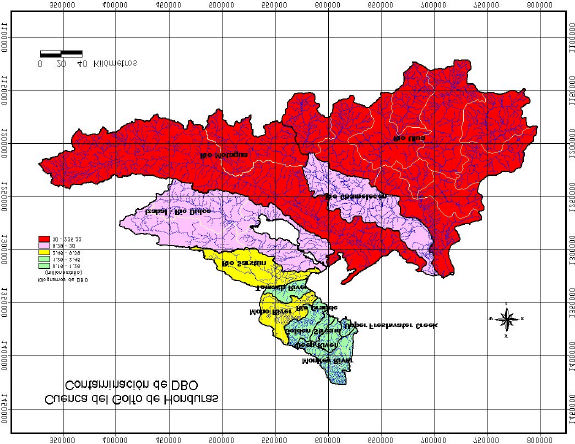
Abt Associates Inc. / Woods Hole Group
Preliminary TDA
Figure 5.3-2. Potential BOD Loads - Gulf of Honduras Watershed
August, 2003
107

Abt Associates Inc. / Woods Hole Group
Preliminary TDA
Figure 5.3-3. Potential Nitrogen Loads - Gulf of Honduras Watershed
August, 2003
108
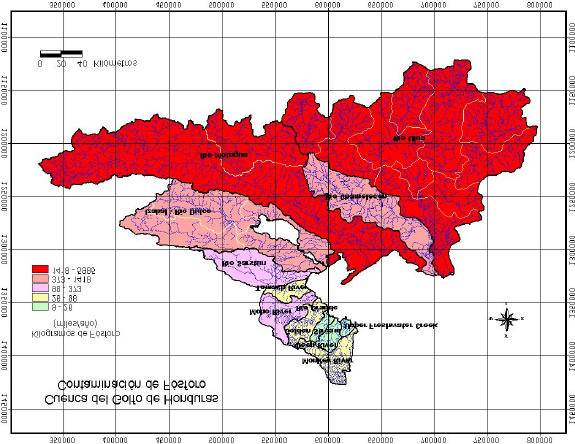
Abt Associates Inc. / Woods Hole Group
Preliminary TDA
Figure 5.3-4. Potential Phosphorus Loads - Gulf of Honduras Watershed
August, 2003
109
Abt Associates Inc. / Woods Hole Group
Preliminary TDA
·
5.4
Preliminary Assessment of the Relative Importance and Local and Transboundary Impact
of Land-Based vs. Ship-Based Sources of Pollution
This section addresses the relative importance of land-based versus ship-based sources of pollution from
both local and transboundary perspectives. The transboundary perspective is important since it is the
basis for intervention by the Global Environment Facility (GEF). The local perspective is important since
it represents one basis for action on a national level, leading oftentimes to measurable improvements to
environmental conditions and resources. Economically, the local condition may attract the major
attention by the country, though transboundary issues may be more critical environmentally.
There are no generally accepted methods for assessing the relative importance of land-based versus ship-
based sources, and most such assessments have been made more or less heuristically. That is the
approach that this assessment takes. Several difficulties compound the assessment process:
·
Lack of quantitative data on land-based sources: The land-based sources of pollution have been
reviewed in Section 5.3. In this section, various sectors were reviewed, including agriculture,
logging, municipal sewage discharge, aquaculture, tourism and industrial discharge. Quantitative and
comparable data for each of these sectors for each of the three countries is not available. In some
countries, for some sectors, data exist, but generally not for all sectors, nor for all countries. This
makes quantification much more difficult. An attempt was made in this TDA to estimate land-based
inputs of nutrients and Biochemical Oxygen Demand; however, ground-truthing has not been done to
verify these estimates.
·
Lack of quantitative data on ship-based sources: The legal and regulatory systems in the region do
not provide for routine monitoring and reporting of environmental activities associated with shipping
and port activities. Spills and marine accidents are sometimes reported, but generally not
methodically. Accident and spill records are not available, so the quantity and composition of spilled
materials are unknown, as are their ultimate fates. Routine sediment and water column monitoring
might shed some light on the environmental degradation caused by port and shipping activities, but
these data are not routinely acquired. Whatever data may exist it was not available for this study.
·
Status and trends of marine resources: There is no coordinated, routine, monitoring of the coastal and
marine resources of the Gulf of Honduras. Fish stocks are poorly understood. Status and trends of
mangroves are not routinely monitored. Status and trends of seagrass beds are not routinely
monitored. Coral reef studies are not consistent across all three countries, and routine monitoring
depends on external resources or cooperative studies. Lacking these monitoring data, it is difficult to
ascribe trends to marine resources, and to quantify the impacts of ship-based and/or land-based
activities on those resources.
·
Lack of economic valuation for the marine resources: The countries within the Gulf of Honduras
apparently have not completed economic valuations of their marine resources. Although commonly
accepted, international valuations are possible, each country may ascribe natural resource values that
are unique to that country, depending on the country's reliance and dependence on those resources.
From a transboundary perspective, it may be appropriate to use global valuations; however, national
valuations provide more clarity on the national situation.
These difficulties make a quantitative comparative assessment of the effects of ship-based and land-based
activities on the transboundary resources hard. This TDA will perform such a comparative evaluation
using the following methodology, however.
August, 2003
110
Abt Associates Inc. / Woods Hole Group
Preliminary TDA
First, some terms are defined:
·
Land-based activities other than ship-based or port-based: This category includes land-based impacts
upon the marine environment, specifically those resulting from sewage, persistent organic pollutants,
radioactive substances, heavy metals, oils (hydrocarbons), nutrients, sediment mobilization, litter, and
physical alteration and destruction of habitat.
·
Ship-based activities: These include those activities related to marine transport and shipping,
including port and harbor activities, dredging, spills, physical alteration of the coastal area
(expansion), accidents, use of dispersants to combat oil spills, etc.
·
Risk factor: A derived value based on the likelihood of the event occurring multiplied by the damage
arising from such an event.
The approach followed for this heuristic relative assessment is based on the following steps:
·
Identification of the level of land-based and ship-based activities (see Sections 5.1-5.3 above), using
quantitative indicators and/or measures where possible (e.g., number of hectares lost due to
agriculture, volume of agrochemicals used in the coastal zone, number of ships operating).
·
Characterization of the trends in these land-based and ship-based activities, generally using
qualitative measures such as rate of population growth, rate of economic growth, rate of shipping
increase. Also, this characterization can be based in part on national policies (encouragement of
agriculture, expansion of shipping, economic focus on oil exploration and exploitation, etc.).
·
Classification of activity as resulting in either local or transboundary impact.
·
Assessment of the types of environmental resources affected by such activities, such as the global
value of resources, its rare or endangered status, its economic value to the region, global biodiversity
value, proximity to protected areas, etc.
·
A qualitative assessment of the risk factor for impacts of such activities: e.g., what is the risk of ship
collision, or the risk of major spillage at a chemical factory; together with its potential scale,
multiplied by the potential damage caused by such an event.
These considerations are used to formulate an overall environmental ranking, in the following manner.
Each factor for each type of activity is given a relative ranking level, based on the following table (Table
5.4-1):
Table 5.4-1. Ranking Scheme for Relative Assessment of Impacts
Factor type
Rank
Explanation
Level of Activity
1
Few activities
2
Moderate level of activity
3
High level of activity
Trend of Activity
1
Decreasing
2
Stable
3
Increasing
Transboundary/local
1
Local impacts
3
Strong transboundary impacts
Types of threatened resources
1
Few
2
Moderate, including some rare, endangered; protected
areas
3
Many, including rare and endangered; high biodiversity
value (e.g., endemic), near protected areas
Risk Factor
1
Low risk factor
August, 2003
111
Abt Associates Inc. / Woods Hole Group
Preliminary TDA
2
Moderate risk factor
3
High risk factor
The following table (Table 5.4-2) summarizes the results of this relative ranking of environmental
impacts. The heuristic analysis shows that of the land-based activities, agriculture and deforestation
possibly play a major role in environmental degradation (where a rank of 11 is arbitrarily picked as a cut-
off between high and low ranking; the mean ranking is 11.2 points). By contrast, six of eleven port-based
or ship-based activities rank at 11 or higher. Of the "other marine-based activities," fisheries ranks as
possibly important, because of its potential transboundary impacts. Data are missing on this activity,
however, and it may rank lower.
An alternative to the above heuristic ranking could be a ranking based on quantitative data. For instance,
once the data tables in section 4 are filled out, the Global International Waters Assessment (GIWA)
ranking for Rapid Assessment of Point Sources (RAP) and non-point sources could be used to estimate
actual contaminant loads (for persistent organics and metals, primarily), and this ranking could be
compared against shipping. However, the shipping-related activities are emphasized by their increasing
trend, proximity to high-value resource areas, including corals, mangroves, seagrasses, marine mammals
and protected areas.
Given available data and information, the following activities are ranked as priorities requiring
intervention to improve the quality of coastal and marine ecosystems:
·
Agriculture
·
Deforestation
·
Port Maintenance
·
Ballast Water
·
Ship Collision
·
Vessel Standards
·
Vessel Discharges
·
Hazardous cargo transport and handling
August, 2003
112
Abt Associates Inc. / Woods Hole Group
Preliminary TDA
Table 5.4-2. Relative Ranking of Environmental Importance of Various Land-Based and Ship-Based
Activities
Activity type
Level of
Trend of
Transboundary
Types of
Risk
Overall
activity
Activity
or Local
Environmental
Factor Environmental
Resources
Ranking
Threatened
Land-Based
Agricultural
High
Increasing
Regional (no
Benthos, water
High
12
evidence of regional
column, including
eutrophication,
fisheries, human
build-up of
health
persistent organic
pollutants)
Deforestation
High
Increasing
Local (increased
Benthos and water
High
12
sedimentation, no
column, mangroves
evidence of regional
and reefs
impacts)
Municipal
High
Increasing
Local (no evidence
Benthos and water
Moder
11
Sewage
of eutrophication)
column, mangroves,
ate
Discharge,
reefs, beaches and
Solid Waste
waterbodies
Aquaculture
Low
Slowly
Local (scale is still
Biodiversity, alteration Low/
7
increasing
small; no evidence
of ecosystems
Moder
of carbon
ate
overloading or
nutrient over-
enrichment)
Tourism
Moderate
Slowly
Local (no
Beaches and reefs
Low/
9
increasing
transboundary
Moder
adverse impacts
ate
identified)
Industrial
Low
Increasing
Local except for
Waterbodies, coastal
High
9
Discharge
(Moderate
some industries (oil
zone
in
exploitation in
Honduras)
Laguna Izabal, for
instance)
Port-based
Port Expansion Low/
Increasing
Local (no evidence
Mangroves, intertidal
Low
8
Moderate
gradually
of regional impacts)
areas, beaches
Port
Moderate/ Increasing
Transboundary
Seagrasses, corals,
Moder
13
Maintenance
High
(dredging effects;
benthic habitat,
ate/
dredge disposal
fisheries, water
High
depending on types
column
of operations)
Loading/
High
Increasing
Local (no evidence
Water column, benthic Moder
10
offloading
of regional impacts)
resources
ate
cargo
Waste
Low
Increasing
Local (no evidence
Water column, benthic Moder
9
generation/
of regional impacts)
resources
ate
Handling
Ballast water
Moderate
Increasing
Transboundary
Any resource: flora
High
14
(movement of
and fauna, marine and
introduced species
coastal, fisheries
across borders)
August, 2003
113
Abt Associates Inc. / Woods Hole Group
Preliminary TDA
Activity type
Level of
Trend of
Transboundary
Types of
Risk
Overall
activity
Activity
or Local
Environmental
Factor Environmental
Resources
Ranking
Threatened
Port-related
Moderate
Increasing
Local (no evidence
Mangroves, benthos,
Moder
10.5
industry
of regional pollution water column
ate/
effects)
High
Marine-based
Ship collision
Low
Unknown
Transboundary (may All resources: benthic,
High
12
occur in
water column, corals,
international waters,
seagrasses, mangroves
may transport across
boundaries)
Inadequate
High
Increasing
Transboundary
All resources
Moder
14
vessel
ate
standards
Vessel
High
Increasing
Transboundary
All resources
High
15
Discharge
(contaminant
transport processes)
Dispersant
Low
Unknown
Transboundary
All resources
Low
9
usage
(transport processes,
effects on resources)
Hazardous
High
Increasing
Transboundary
All resources
Moder
14.5
cargo
ate/
High
Other Marine
Activities
Fishing
Moderate
Increasing
Transboundary
Fisheries
Low
10
(stocks may be
affected by one
country's actions)
Anchoring
Low
Moderately
Local
Benthos
Low
6
stable
Marine
Low
Moderately
Too little data
Benthos, fisheries
Low
6
collections
stable
available
August, 2003
114
Abt Associates Inc. / Woods Hole Group
Preliminary TDA
6.0 STAKEHOLDER ANALYSIS
The following stakeholder analysis is primarily based on a series of regional stakeholder meetings, one-
on-one interviews and a survey. Regional stakeholder meetings were held in San Pedro Sula, Honduras,
Guatemala City, Guatemala and Belize City, Belize. One-on-one meetings were carried out at site visits
and the regional meetings. A standard survey form was created for the stakeholder interviews in order to
provide a framework that combined both structured and open-ended questions. The survey was designed
to collect detailed information about the institutional and legislative frameworks, strengthening needs, and
working relationships among the sectors. Stakeholder consultations were not intended to provide a
comprehensive analysis of all Project beneficiaries and decision-makers. The meetings were an initial
outreach effort to both inform and incorporate observations from representative stakeholder groups.
6.1
Links with other International and Regionally Significant Projects and Institutions
The following section provides an overview of international organizations and programs that have
regional significance to the GEF Project by contributing to capacity building, and institutional and
regulatory strengthening in the areas of environmental and natural resource management, port operation,
and navigational safety.
International Maritime Organization
The International Maritime Organization (IMO) Convention entered into force in 1958. The OMI
Convention was created "to provide machinery for cooperation among Governments in the field of
governmental regulation and practices relating to technical matters of all kinds affecting shipping engaged
in international trade; to encourage and facilitate the general adoption of the highest practicable standards
in matters concerning maritime safety, efficiency of navigation and prevention and control of marine
pollution from ships".(IMO website). The adoption of maritime legislation has been one of the IMO's top
priorities. Approximately 40 conventions and protocols have been adopted by the IMO and most of them
have been amended to ensure that they are kept current.
The IMO's most important effort in terms of addressing marine pollution has been the International
Convention for the Prevention of Pollution from Ships, 1973, as modified by the Protocol of 1978
(MARPOL 73/78). It covers oil pollution from accidents and routine operations. MARPOL also includes
other types of pollutants such as chemicals, cargo, sewage, solid waste, and air emissions. In other
conventions, the IMO addresses the system for providing compensation to those who have incurred
financial damages as a result of pollution.
The IMO has promoted the establishment of regional port control systems providing for inspection of
ships in foreign ports to ensure that they meet IMO standards. Organizing regional inspections has helped
conserve limited resources in developing countries.
The IMO maintains a technical cooperation program that is designed to assist governments that require
capacity building and resources. The IMO has emphasized issues of container safety, bulk cargoes, and
liquefied gas tankers. The quality of maritime personnel has been addressed through establishment of
crew standards and the adoption of a convention on training standards, certification, and watchkeeping.
Amendments to the International Convention on Standards of Training, Certification and Watchkeeping
for Seafarers, strengthened standards and gave the IMO authority to check government actions.
Inter-American Port Commission
In 1996, the General Assembly of the Organization of American States (OAS) upgraded the classification
of the port forum from "Port Conference" to "Port Committee". The new OAS classification provided the
Inter-American Port Commission (IPC) with additional technical, financial, and decision-making
August, 2003
115
Abt Associates Inc. / Woods Hole Group
Preliminary TDA
autonomy. The proposal was approved by the Inter-American Council for Integral Development (CIDI)
and authorized by the OAS General Assembly in 1998.
The IPC mainta ins Technical Advisory Groups (TAG) that provide technical advice to the Commission
on different aspects of port sector development. Member countries may appoint a representative to each
TAG. TAG members are selected from port operations; academic, scientific, commercial, financial,
industrial institutions and other organizations involved in maritime-related activities. The IPC maintains
a navigational safety and environment committee that provides for exchange of information, identification
of training needs, preparation of studies and technical documents, and organization of national and
international conferences.
In general, the IPC operates at a high diplomatic level rather than addressing operational issues at the
national and subnational levels. The IPC collaborates with the Inter-American Development Bank, World
Bank, Economic Commission on Latin American and the Caribbean, the International Labor
Organization, Central American Commission of Maritime Transport, the United Nations Conference for
Trade and Development, and the IMO, among others.
Central America Integration System
The Central American Integration System (Sistema de la Integración Centroamericana, SICA) is an
international organization created by the Tegucigalpa Protocol of the Organization of Central American
States. Its member countries include Guatemala, El Salvador, Honduras, Nicaragua, Costa Rica, Panama
and Belize. The goal of SICA is the creation of an integrated Central America. Its program areas include
democracy, regional security, economic well-being, auto-determination, environment, and sustainable
development. SICA has two important regional commissions, COCATRAM and CCAD, which together
have contributed significantly to planning initiatives in the areas of maritime pollution control and
navigational security.
Central American Maritime Transport Commission
The Central American Maritime Commission (Comisión Centroamericana de Transporte Marítimo,
COCATRAM) was created in 1980 by the Ministers Transportation Council. COCATRAM is a regional
organization that forms part of the Central American Integration System. COCATRAM works with both
the public and private sectors of its member countries providing technical assistance and capacity building
in areas related to international transport including security, environment, facilitation, and legislation.
COCATRAM works directly with regional organizations including the ministries of transportation,
maritime administrations, port administrators and both users and providers of international transportation.
Both Guatemala and Honduras are members of COCATRAM. Belize is not a member, but maintains
informal relations.
COCATRAM implements its work in the region through different specialized fora that coordinate directly
with their institutions' including:
·
TRAINMAR
·
REPICA
·
ROCRAM-CA
·
Country-level liaison committees
·
Network of Regional Port statisticians
COCATRAM maintains a small permanent staff consisting of four department managers. Projects are
staffed through the use of contractors. COCATRAM's budget is supported equally by each of its member
August, 2003
116
Abt Associates Inc. / Woods Hole Group
Preliminary TDA
countries (Guatemala, Honduras, Nicaragua, Costa Rica and Panamá). COCATRAM also receives
international funding to execute regional projects.
COCATRAM is the focal point for the IMO in Central America. Examples of activities that
COCATRAM coordinates and implements for the IMO include the adoption and ratification of
international conventions and capacity building programs. COCATRAM also collaborates with the
United Nations and has been designated as the Secretariat for the Northeast Regional Seas Program
(NRSP) since 2001. NRSP activities have included updating of contingency plans at ports in the region
and the preparation of a regional capacity building plan.
COCATRAM has established itself as an important institution in Central America with ties to
international institutions such as IMO, IPC, CCAD, multi-lateral funding agencies, and other institutions
working on maritime pollution and safety issues. A representative from COCATRAM participates in the
Regional Stakeholder Advisory Committee.
Central American Commission for the Environment and Development
The Central American Commission for the Environment and Development (Comisión Centroamericana
de Ambiente y Desarrollo, CCAD) was created in 1989 with the goal of creating awareness of
environmental awareness, strengthening institutions involved in natural resources and environmental
protection, and assisting with the harmonization of related legislation to incorporate sustainable
development issues into national development plans. CCAD also seeks to promote participatory
decision-making and decentralization of governmental activities. Honduras, Belize, and Guatemala are
members of CCAD.
Since its creation in 1989, CCAD has focused on the institutionalization of environmental and sustainable
development programs. CCAD advanced the creation of a Central American Interparliamentary
Commission for the Environment and Development (Commission Interparlamentaria Centroamericana de
Ambiente y Desarrollo, CICAD). CCAD also promoted and obtained the creation of a regional initiative
to integrate political, economic, social and environmental issues to promote sustainable development.
The Alliance for Sustainable Development (La Alianza para el Desarrollo Sostenible, ALIDES) advocates
a regional approach to sustainable development and synergy of regional efforts as opposed to individual
national efforts. ALIDES promotes responsibilities and rights outlined in Agenda 21. The Central
American Regional Environmental Plan (Plan Ambiental de la Región Centroamericana, PARCA)
continues to be the medium and long-term strategy to address environmental issues in the region. CCAD
has expanded its outreach effort with the addition of its Environmental Dialogue (Diálogo Ambiental)
initiative in which civil society uses its web site as part of its public consultation process.
Trinational Alliance for the Conservation of the Gulf of Honduras
In 1997, eight nongovernmental organizations from Belize, Honduras and Guatemala joined forces to
form the Trinational Alliance for the Conservation of the Gulf of Honduras (Alliance). Its executive
representation alternates every two years among the project countries. The legal and political trinational
framework of the project is defined by the following:
·
The Central American Alliance for Sustainable Development
·
The Tulum Declaration
·
The Initiative for the Mesoamerican Coral Reef System.
·
The Initiative and Project for the Mesoamerican Biologic Corridor
Protected areas are managed by each country's agencies and coordinated with project efforts. The project
goal is to establish and consolidate public participation processes for information, planning, consultation
August, 2003
117
Abt Associates Inc. / Woods Hole Group
Preliminary TDA
and co-management of the natural resources of the Gulf of Honduras in order to ensure its long-term
conservation and sustainable use. The project strives to foster trinational exchanges and resolution of
conflicts related to the management of the coastal development of the Gulf of Honduras.
The Alliance has undertaken a range of activities that are planned to increase the knowledge of
sustainable development issues in the Gulf of Honduras, strengthen the institutions and regulatory
framework for the region, and foster collaborative activities and agreements among the three countries.
The Alliance also reviews the compliance of each member country with respect to implementing the
provisions of its laws and regulations governing protected areas. Representatives from several member
organizations of TRIGOH participate on the Regional Stakeholders Advisory Committee.
PROARCA/COSTAS
PROARCA is a five-year, USAID-funded program with the goal to promote an effective regional
environment stewardship. PROARCA's principal partner is the Central American Integration System
(SICA) and its Environment Division, the Central American Commission for Environment and
Development (CCAD) is the lead regional counterpart organization in implementation of PROARCA.
PROARCA has several program components that contribute to the advancement of protected areas in the
Gulf of Honduras. Project objectives include:
·
Consolidation of the Central American Protected Areas System (CAPAS) by increasing the number
of protected and special management areas under improved management
·
Increase of local stewardship of the environment by helping local communities manage coastal and
forest resources
·
Harmonization and strengthening of Central American environmental policy frameworks by
supporting the drafting and introduction of environmental laws and regulations to national
legislatures/executive branches.
PROARCA has a representative participating on the Regional Stakeholder Advisory Committee.
Mesoamerican Barrier Reef System Project
CCAD approached the World Bank in 1997 to request support for the conservation and sustainable use of
the MBRS. An Action Plan was prepared with financial support from GEF and technical support from
the World Bank, the government of Mexico and other international organizations. The MBRS Action
Plan provides the basis for a comprehensive program of regional and national-level activities directed at
protecting the Mesoamerican Barrier Reef System and providing for its social and environmental
sustainability. The Action Plan includes the following program areas: integrated land use planning,
research and monitoring, education and information dissemination, establishment of marine protected
areas, development of sustainable tourism, maintenance of water quality and pollution prevention,
capacity building, institutional strengthening, participatory management, financial sustainability,
harmonization and strengthening of legal frameworks, and regional coordination. A representative from
the MBRS participates on the Regional Stakeholders Advisory Committee.
6.2
Stakeholder Consultations
Transboundary projects are inherently complex due to multiple layers of political issues and the relative
newness of multi-stakeholder projects to addressing both national and regional technical and management
issues. However, the benefits can also be greater than individual country programs, because of the
opportunity to leverage resources, collaborative problem-solving, and regional harmonization of
institutions and legislation.
August, 2003
118
Abt Associates Inc. / Woods Hole Group
Preliminary TDA
Reoccurring themes and challenges were identified in the consultations with stakeholders. In general, the
observations were generally along sector lines with fewer differences among countries. Many technical
and management professionals were not familiar with the project and the one-on-one stakeholder
meetings provided an opportunity to inform them about project advances. All interviewees were positive
about the need for a project addressing both marine pollution and navigational safety issues. Global
observations expressed during the regional workshops and individual meetings include:
·
Need for stakeholder participation and Project `ownership'.
·
Develop financial sustainability during the Project's initial phase.
·
Review existing regional programs and create linkages where indicated to avoid gaps or duplication
of efforts.
·
Streamline project organization to reduce resource and personnel strain for the Project and
stakeholder participants.
·
Information-sharing and management are challenges at the national level with an additional layer of
complexity at the transboundary level by adding political considerations and coordination.
6.2.1
Public Sector National and Local Government
Initial Findings
Belize, Guatemala, and Honduras have ratified and are signatories to MARPOL and the principal
conventions covering marine pollution and navigational security in the Gulf of Honduras. However,
meetings with professionals working in these program areas and review of the literature, reinforce
observations that conventions without implementing regulations have limited the effectiveness of
inspections and enforcement actions. Limited inter-agency and intra-agency coordination and unclear
lines of authority often result in gaps and duplication of efforts in regulatory responsibilities. Several
national agencies responsible for maritime pollution control indicating they were not implementing
program activities due to competing agency priorities. The Regional Action Plan "La Agenda de
Seguridad Ambiental Maritimo Portuario de Centroamerica" prepared through a collaboration of
COCATRAM, CCAD and PROARCA was cited as a useful document that has advanced maritime
environmental issues in the region.
All agencies reported financial considerations as a critical factor impeding full implementation of their
programs, particularly inadequate staffing and equipment shortages. Equipment needs range from
computers and vehicles to specialized equipment needed for spill containment, clean up, and
environmental monitoring.
Guatemala and Honduras have national laws that provide the municipalities with the authority to conduct
environmental programs within their jurisdictions including inspections and enforcement actions. In the
areas of maritime pollution control, the municipal environmental departments have focused on waste
disposal from ships and the handling and disposal of hazardous wastes. Reports from Guatemalan and
Honduran municipalities indicate that their contact with their respective Port Authority, Merchant
Marines, or Navy has been limited and not pursued to the fullest extent. This has been attributed to
limited staff resources and competing agency priorities.
Honduras has legal and institutional frameworks that provide for environmental management by the
municipalities. The Constitution, Municipalities Law, Law of Administrative Procedures, and the
August, 2003
119
Abt Associates Inc. / Woods Hole Group
Preliminary TDA
National Environmental Law all contain provisions delegating certain authorities to the municipalities for
the operation of programs, enforcement, and collection of sanctions within their jurisdictions. The
National Environmental Law provides the municipalities with the responsibility, in coordination with the
Secretariat of Natural Resources and the Environment, for assuming the delegation of authority within its
respective jurisdiction.
The Honduran National Environmental Law provides the municipality with the functions of water
resource protection, prevention and control of disasters and emergencies, regulation of contaminant
discharges in compliance with national norms, and participation in the National System of Environmental
Impact Assessment (Sistema Nacional de Evaluación de Impacto Ambiental, SINEIA). An example of a
Memorandum of Agreement between the Honduran Secretary of Environment and Natural Resources and
the Municipality of Puerto Cortes is provided in Appendix C. It is an example of existing legal and
institutional mechanisms that the Project can facilitate to strengthen the contributions of municipalities to
the Project and in their jurisdictions.
In Guatemala, the Presidential Commission for the Reform of the State of Guatemala, Decentralization
and Public Participation (COPRE) was formulated by Decree 12-2002 and the creation of a new
Municipal Code. The decentralization of government jurisdictions provides the municipalities with the
administration of drinking water, sewer systems; collection, treatment and disposal of solid waste;
construction permits; and administration of natural resources in the municipality. The municipal
government is also responsible for preparing and implementin g land use plans and control of construction
through issuance of permits.
In contrast to Guatemala and Honduras, most decision-making processes in Belize occur at the national-
level. Sector programs at the local level primarily involve development of annual projections, baseline
data collection and public consultation. The emphasis on centralized management has limited the
government's ability to target local needs. In recent years, there have been several regional planning
initiatives that have promoted vertical integration of government services and strengthened public
participation.
In Belize, revenue from all sectors collected at the local level, goes into the General Revenue. This is an
important consideration when evaluating funding mechanisms for the project, because it complicates or
possibly limits applications of local revenue generation for GEF Project activities.
In all three countries, there is limited access to institutions capable of providing environmental laboratory
analysis and monitoring services. Academic institutions offering degrees or professional certification
courses in fields related to maritime pollution control and navigational safety are also rare in the region.
The Project should consider strengthening universities and other institutions to provide more
opportunities for contracting environmental laboratory analysis, training, and professional development
courses in the GEF Project areas.
Issues highlighted in Public Sector Stakeholder Meetings:
·
Need to promulgate regulations for MARPOL and other key international conventions
·
Inadequate coordination and communication among national agencies and between national and local
government agencies.
·
Fragmentation of agency responsibilities include unclear or ignored agency mandates and overlapping
jurisdictions
·
Need for training assessments and follow up
August, 2003
120
Abt Associates Inc. / Woods Hole Group
Preliminary TDA
·
Government generally has inadequate resources, equipment, and staffing to execute functions
·
Difficulty with staff retention
Discussion
Interviews with government representatives found that inadequate resources are probably the most
significant impediment to execution of regulatory responsibilities. The situation is more severe for local
government. Because of limited financial and human resources, the Project should consider focusing on
the strengthening of a few priority actions rather than a large-scale planning effort. The successful
implementation of specific actions can be subsequently phased into larger planning actions in conjunction
with a financial plan developed by the Project.
There are three principal challenges that institutional strengthening projects typically encounter to
achieving long-term project benefits - 1) Staff retention, 2) Creation of permanent information
repositories, and 3) Financial sustainability of programs. The Project should consider addressing these
issues by linking funding and training to specific institutional commitments. These problems are
pervasive in Latin America and often result from the political instability of public sector employment at
all levels and the organizational culture of government agencies. However, GEF Project performance will
be greatly enhanced by attempting to address these issues through project planning and funding
agreements.
In recent years, local governments in Latin America have been delegated more responsibilities through
decentralization of national government programs and the acknowledgement of the role of local
government. Guatemala and Honduras both have a legal framework that provides for the delegation of
responsibilities from national government to the corresponding local government authorities.
Unfortunately, the decentralization of responsibilities has not necessarily been accompanied with
financial and technical support to the municipalities. The result has been that the additional
responsibilities have been largely theoretical as under-funded and under-staffed local government
agencies attempt to execute their traditional responsibilities while assuming the additional delegated
authorities. Strengthening local government will provide greater efficiency through closer work
relationships with local stakeholders, increased public participation, and ultimately more accountability
by the regulated community.
The Project provides a regional opportunity to promote inter-sectoral collaboration. In particular, the
project should encourage public -private sector collaboration to facilitate better working relationship
between the regulators and the regulated community. Civil society has also demonstrated the ability to
advance of public sector programs. Public sector-civil society collaboration is increasing in Belize and
Caribbean countries.
The nature of a transboundary project requires that participating countries recognize that benefits from
regional collaboration require a new perspective in terms of national policy. The Gulf of Honduras
region has historically had territorial conflicts and the GEF Project should support international efforts to
create buffer zones to relieve potential areas of political disaccord. Creation of transboundary protected
areas can be useful and may have applications for the Gulf of Honduras, particularly between Guatemala
and Belize.
Proposed project actions for the public sector include :
·
Preparation of a detailed legal and regulatory analysis.
August, 2003
121
Abt Associates Inc. / Woods Hole Group
Preliminary TDA
·
Harmonization of national-level policies and legislation to support the implementation of
international conventions addressing maritime pollution control and navigational safety.
·
Development of templates to strengthen national legislation and promulgate regulations to comply
with international conventions covering marine pollution control and navigational safety.
·
Institutional strengthening of government agencies to address fragmentation of responsibilities and
clarify agency jurisdictions. Strengthening of local government should include definition of
delegated activities and coordination with national agency counterparts. Where required, the Project
should assist with the drafting of MOUs to assist with delegation of activities and identification of
revenue generating sources for local government contributions.
·
Development of train-the-trainer courses for national and local government officials.
·
Development of a funding strategy that can generate fees for local government services.
·
Development of a public -private sector demonstration project
·
Preparation of a staff retention strategy for project-trained personnel.
·
Improve access to professional development certifications and academic training in project-related
fields by creating project linkages with local universities and institutes to strengthen existing
programs and, where necessary, create new ones.
6.2.2
Civil Society
Initial Findings
Environmental organizations in the region have been active in establishing marine protected areas and
proactive in advancing an agenda to promote harmonization of legislation and building institutional
capacity for maritime pollution control and navigation safety. As an example, TRIGOH is addressing
transboundary issues related to maritime pollution control and navigational safety. This is a logical
component of coastal management that remains vulnerable to contamination from normal operational
activities from ships and ports as well the catastrophic consequence of an oil spill. Specific issues
highlighted by environmental organizations include:
·
Few opportunities to participate in the decision-making process
·
Need for project sustainability through stable project financing
·
Need for capacity building and project-specific training for NGOs
Of the three countries, environmental organizations in Guatemala have been the most successful in
advancing a regional agenda for protecting the Gulf through harmonization of legislation, creation of
protected areas, and promoting a regional agenda for marine pollution control and navigational safety.
There are regional examples where NGOS have contributed to preparation of spill contingency plans and
participation in awareness building concerning the need to strengthen regional capacity for the
management of maritime pollution and navigational safety. NGOs have successfully collaborated with
regional organizations such as CCAD. TRIGOH is contributing to the implementation of
PROARCA/COSTAS. Discussions with both NGOs and COCATRAM indicated that presently there is
limited interaction. This is probably due to COCATRAM's focus on user groups comprised primarily of
industry, port operators, and government.
August, 2003
122
Abt Associates Inc. / Woods Hole Group
Preliminary TDA
Belize has an active environmental nongovernmental organization, TIDE that forms part of TRIGOH's
trinational alliance of environmental NGOs in the Gulf of Honduras. TIDE works in the areas of
environmental education, protected area management, and environmental monitoring. TIDE is a well-
developed organization with 25 employees.
In addition to TRIGOH, Belize participates in BEMAMCCOR, another transboundary working group for
protected areas and wildlife. Together, the two NGOs contribute to several protected areas including
Sarstoon Temash National Park, Corozal Bay Wildlife Sanctuary, Aguas Turbias National Park, and Rio
Bravo Conservation and Management Area. These transboundary areas form part of the regional projects
of Mesoamerican Biological Corridors Project (MBCP) and the Mesoamerican Barrier Reef System
Project (MBRS).
Discussion
The Gulf of Honduras benefits from an active and well-respected network of environmental
organizations. NGOs from TRIGOH demonstrate a network that links the three countries. Environmental
NGOs have shown the capability to link transboundary environmental programs that might otherwise
have been hampered by government protocol and bureaucracy. The Project will benefit from their
participation as technical experts in the project, but possibly more importantly is the public education and
outreach support.
Proposed Project Actions:
·
Incorporation of civil society participation in all decision-making components of the Project.
·
Include civil society as one of the target groups for technical training.
·
Review legal and institutional recommendations of the Project for adequate public consultation
provisions.
·
Evaluate feasibility of pilot projects testing new or under-utilized collaborations between civil society
and the private and public sectors.
6.2.3
Private Sector
Initial Findings
In recent years, the development and use of large tankers and container vessels has necessitated the
transformation of port facilities and related infrastructure. During the 1980s, substantial reforms were
made in the area of port organization and administration. These reforms were initiated by state port
institutions that turned to private sector involvement in port management. Guatemala, Honduras and
Belize have concessioned much of the day-to-day operation. The national government's role has focused
more on compliance of global issues and municipalities have focused on the regulation of select local
issues. Meetings with the private sector focused on shipping and port operations.
Texaco in Honduras indicated that they operate in accordance with U.S. laws, company policies, and
compliance with the requirements of the IMO. They comply with inspections by the Merchant Marines
and SERNA. They indicated that there are also local government requirements that are generally
unenforced. Primary concerns expressed by Texaco included a general lack of enforcement of hazardous
materials handling, disposal, and transportation requirements; the need for uniform ship standards; and
inadequate off-loading of petroleum and chemicals by some ships. The Texaco's experience is
representative of large international companies that rely primarily on self-monitoring for compliance and
are often the only organizations with in-country capability to respond to oil spill accidents.
August, 2003
123
Abt Associates Inc. / Woods Hole Group
Preliminary TDA
Information provided by Banana Enterprises Limited of Belize indicated that solid waste and ballast water
discharge continue to be environmental problems. Training and awareness building is available to port
operators and suggestions were made that the shipping industry needs to be included in future trainings.
Specific issues highlighted include:
·
Need to have uniform enforcement of shipping regulations.
·
Need to strengthen local capacity to conduct inspections and enforce regulations.
·
Need to strengthen government capacity to conduct oil spill contingency planning and respond to
emergencies.
·
Capacity and awareness building should be expanded to include the shipping industry as well as port
operators
Discussion
The Project will need to strengthen outreach to the private sector, particularly shipping companies.
Private sector acceptance is crucial to the successful implementation of new and existing regulations, and
permit requirements. Generally, the public sector is under-staffed with limited resources that hinder the
ability to fully implement a comprehensive enforcement program. The Project should consider actions to
direct funding to inspectors. As part of the institutional strengthening component, it may be feasible to
consider privatization of ship and port inspections. An alternative approach is to shift the compliance
burden to the private sector by requiring documentation of compliance with permits and environmental
monitoring data, and supplementing the information with interim government inspections. Examples of
self-monitoring include ballast wate r logs, wastewater discharge permits, and solid waste manifests.
Proposed Project Actions
·
Expand private sector participation in technical training and include opportunities for collaboration as
a technical leader.
·
Include the private sector in regula tion development and institutional strengthening activities
including creation of a project legislative workgroup with industry participation.
·
As part of the Project financial strategy, evaluate options to create a fund or provide low-interest
loans to the private sector for purchase of equipment, monitoring services, or implementation of
industry best practices to comply with national and international requirements
·
Develop demonstration projects that provide for public -private and private-civil society collaboration.
August, 2003
124
Abt Associates Inc. / Woods Hole Group
Preliminary TDA
7.0 Environmental Quality Objectives
Two overarching Environmental Quality Objectives have been identified as a possible basis for long-term
action to improve the Gulf of Honduras environment. These EQOs were discussed at regional meetings
during preparation of the project (e.g., Guatemala, March 2003), but they are only draft at this stage. As
part of the full TDA/SAP process, the EQOs will be updated and strengthened. They are presented here
only to indicate the major environmental drivers for the region.
Stabilized Marine and Coastal Water Quality
TARGETS
1. Reduce pollution from port and other land-based activities in the Gulf of Honduras by 25% by
2008
2. Reduce pollution from marine activities by 50% by 2008
3. Reduce risk of marine accidents, including coral destruction, by half by 2013
Prevention of Degradation of Sensitive Coastal and Marine Habitats
TARGETS
1. Rate of decline in the quality of selected coral reef sites halved by 2013
2. Rate of decline in the quality of selected mangrove sites halved by 2013
3. Stabilize seagrass inventory by 2020
August, 2003
125
Abt Associates Inc. / Woods Hole Group
ADT Preliminar
8.0 Bibliography
Authors unknown:
Atlas De Honduras. 1999.
Background of Gladden Spit Marine Reserve.
Belize National Report on Protected Areas
Informe Nacional de Areas Protegidas de Honduras.
Plaguicidas y Salud en Honduras
Transboundary Diagnostic analysis for the Caspian Sea. Vol. 2
World Bank Participation Sourcebook. Environmentally Sustainable Development. Feb. 1996.
Abt Associates. 2002. Diseńo de un Plan de Monitoreo y Evaluación De Alternativas Técnicas de Manejo
de Cuencas. BID- TC-99-11-152; ATN-SF/7282-GU. Ministerio de Agricultura Ganadería y
Alimentación (MAGA). Guatemala.
Abt Associates. 2002. Montaje y Aplicación del Modelo Hidrológico SWAT en la Cuenca del Río Nizao.
Proyecto de Manejo de Tierras Regadas y Cuencas (PROMATREC) Préstamo BIRF 3875-DO.
Instituto Nacional de Recursos Hidráulicos INDRHI. República Dominicana.
Abt Associates. 1998. Plan de Acción Ambiental, para la Mondernización de la Municipalidad del
Distrito Central, Honduras. Prepared for the Inter-American development Bank and the
Municipality of the Central District, Honduras. August 1998.
Administración Forestal del Estado, (AFE-COHDEFOR), Centro de Información y Estadisticas
Forestales (CIEF). Anuario Estadistico Forestal 2001.
AES Honduras. 2001. Evaluación de Impacto Ambiental Planta de Generación de Puerto Cortés,
Terminal de Importación de GNL y Línea de Transmisión de 230 kV Honduras. Volumen 1.
Andrade, C.A. and E.D. Barton. 2000. Eddy development and motion in the Caribbean Sea. Journal of
Geophysical Research, 105, 26191-26201.
Andréfouët, S., P.J. Mumby, M. McField, C. Hu, and F.E. Muller-Krager. 2002. Revisiting Coral Reef
Connectivity. Springer-Verlag. Coral Reefs (2002) 21:43-48.
Ardón, José Vinicio Martínez. 2000. Protegiendo la Bahía de Amatique, Guatemala: El Caso del
Comité de Seguridad Portuaria. Funded by PROARCA / COSTAS. Guatemala City.
Ardón, José Vinicio Martínez. 2000. Seguridad Ambiental Portuaria y Transporte Marítimo: Caso de
Estudio de Izabal. Funded by PROARCA / COSTAS. Guatemala City.
Ariola, Eugene A. and Philip Morgan. 1999. A Review of the Hydrology in the Southern Region of
Belize. Draft. Prepared for the Environmental and Social Technical Assistance Project.
June 2, 2003
127
Abt Associates Inc. / Woods Hole Group
ADT Preliminar
Banco Centroamericano de Integración Económica Departamento de Planificación y Presupuesto. 2002.
Guatemala: Informe Económico Primer Trimestre de 2002. Tegucigalpa.
Banco Centroamericano de Integración Económica Departamento de Planificación y Presupuesto. 2002.
Honduras: Informe Económico Primer Trimestre de 2002. Tegucigalpa.
Banco Interamicano de Desarrollo. 1997. Honduras: Informe de Impacto Ambiental y Social: Proyecto
de Saneamiento de Puerto Cortés Agua Potable y Saneamiento.
Beca International Consultants, Ltd. 1995. Belize Southern Highway Rehabilitation Project:
Environmental Impact Assessment. Prepared for the Government of Belize. New Zealand.
Belize Coastal Zone Management Authority and Institute. Agency brochure.
Belize. Ministry of Finance. Central Statistical Office. 2000. Environmental Statistics for Belize 2000.
Belmopan.
Belize. Ministry of Finance. Central Statistical Office. 2000. 2000 Population Census Major
Findings. Belmopan.
Belize. Ministry of Finance. Central Statistical Office. 2001. 1999 Belize Family Health Survey
Females. Belmopan.
Belize. Ministry of Finance. Central Statistical Office. 2001. 1999 Belize Family Health Survey
Males. Belmopan.
Belize. Ministry of Finance. Central Statistical Office. 2001. Abstract of Statistics 2000-2001.
Belmopan.
Belize. Ministry of Finance. Central Statistical Office. 2001. Abstract of Statistics November, 2001.
Belmopan.
Belize. Ministry of Economic Development. 1999. Review of Agriculture in Southern Region of Belize.
A document of the Environmental and Social Technical Assistance Project (ESTAP). Belize.
Belize. Ministry of Natural Resources. 1998. Belize's First Interim National Report Submitted to the
Convention on Biological Diversity. Belize.
Belize. Ministry of Natural Resources, Environment, and Industry. 2002. Belize National Report to the
World Summit on Sustainable Development. Belize.
Belize. Ministry of Tourism and Culture. Belize Tourism Board. 2001. Belize Travel and Toursim
Statistics: January December 2001.
Belize Fisheries Department. 2001. Capture Fisheries Statistical Report 2001.
Brenes, C.L., T. Gallegos, and E. Coen. 2001. Annual variation of skin temperature in the Gulf of
Honduras.
Caribbean Environment Programme (CEP) / UNEP. 1995. Evaluation of the Coastal and Marine
Resources of the Atlantic Coast of Guatemela. CEP Technical Report No. 34.
June 2, 2003
128
Abt Associates Inc. / Woods Hole Group
ADT Preliminar
Caribbean Environment Programme (CEP) / UNEP. Manatee Management Plan. CEP Technical Report
No. 35.
Carton, J.A., and Y. Chao, 1999. Caribbean Sea eddies inferred from TOPEX/POSEIDON altimetry and
a 1/6° Atlantic Ocean model simulation. Journal of Geophysical Research, 104, 7743-775.
Centro de Estudios y Control de Contaminantes. 2001. Cuaderno Sobre el Estado Sanitario y Ambiental
de Honduras, Numero 5. Tegucigalpa.
Cerrato, Carlos A. 2003. Diagnóstico Ambiental Cualitativo Profundización del Canal de Acceso
Instalaciones Portuarias de Puerto Cortés. Plan de Manajo Ambiental. Tegucigalpa, Honduras.
CIAT. Diagnostics and Prioritization of the Hydrographic River Basins for the Program of Sustainable
Rural Development in High-Priority Hydrographic River Basins (Ho-0179.) Closing
Consultancy Report. Funded by Inter-American Development Bank (IADB).
Coastal Zone Management Authority and Institute (CZMAI). 2000. State of the Coast Report 1999:
Belize. Funded by the Global Environmental Facility / United Nations Development Program
(UNDP/GEF), the European Union (EU), and the Government of Belize. Belize City.
Coastal Zone Management Authority and Institute (CZMAI). 2000. Maps of the (Belize) 1999 State of
the Coast Report. Funded by the Global Environmental Facility / United Nations Development
Program (UNDP/GEF), the European Union (EU), and the Government of Belize. Belize City.
COCATRAM and PROARCA COSTAS. Plan de Acción de la Agenda de Seguridad Ambiental
Maritimo Portuaria en Centroamerica. Jan. 2002.
Comisión Centroamericana de Ambiente y Desarrollo (CCAD). 2002. Directrices Plan Operativo
Annual. 2003. Nov. 2002.
Comision Centroamericana de Transporte Maritimo. Resumen Estadistico Portuario Regional Del Istmo
Centroamericano Ańo 2001.
Comisión Ejecutiva Valle de Sula. 2002. Plan de Desarrollo Estratégico: Cuenca del Ulúa y
Chamelecón Honduras. Informe Final Volumen 1.
Consejo Nacional de Areas Protegidas Presidencia de La Republica Guatemala (CONAP). Informe
Nacional de Áreas Protegidas de Guatemala.
Departmento Actuarial y Estadístico de Instituto Guatemalteco de Seguridad Social: Trabajadores
Afiliadosal IGSS, Según Rama de Actividad Economica 1996 2000.
Departamento de Investigación y Servicios Hídricos, Insivumeh Boletín Día Mundial Del Agua. 22 de
marzo de 2003. Agua para el futuro.
De Vries, Jaap and Micaela Schuster, Paul Procee, Harry Mengers. Institute for Housing and Urban
development Studies. Prepared for the Inter-American Development Bank, Environment
Division. January 2001.
June 2, 2003
129
Abt Associates Inc. / Woods Hole Group
ADT Preliminar
DDH. 2002. Estudio Medioambiental Detallado: Instalaciones de la Empresa Nacional Portuaria
Honduras, Centro América. Programa de Protección Ambiental del Puerto de Puerto Cortés.
Versión Final.
DHV Consultants BV. 1994. Environmental Impact Assessment: Southern Highway Rehabilitation
Project, Belize. Final Report. Funded by Ministry of Tourism and the Environment -
Government of Belize and Inter-American Development Bank (IADB). Amserfoort.
Dominguez, S. 2002. Honduras Sustainable Coastal Tourism Project. Report 2: Honduras:
Enviornmental Education and Tourism on the North Coast of the Bay Islands. Hawkins &
Associates Inc., Washington DC. Contract No. 7107100. Submitted to: Environmental Sector
Management Unit, Central America Country Management Unit, Latin America and the Caribbean
Regional Office, The World Bank.
Dulin, Paul, Juan Bezaury, Melanie Dotherow-McField, Manuel Basterrechea, Bessy Aspra de Lupiac,
and Jonathan Ezpinoza. 1999. Conservation and Sustainable Use of the Meso-American Barrier
Reef System in Mexico, Belize, Guatemala, and Honduras: Threat and Root Cause Analysis.
(draft).
Ellison, Aaron M. Wetlands of Central America. Department of Biological Sciences and Program in
Environmental Studies, Mount Holyoke College.
Ediciones Ramsés. 1996. Fauna de Honduras en Peligro de Extinción. Imreso en Colombia por D'vinni
Ltda.
Empresa Portuaria Nacional Santo Tomás de Castilla (EMPORNAC). 2002. Informe Estadistico 2002.
Espinoza, Mayra A. 1996. Condiciones de Aqua y Saneamiento de Honduras 1990-1995: Análisis de la
Encuesta de Hogares. Tegucigalpa.
ETOPO2 Global 2' Elevations, September 2001, NOAA/NGDC, Assembled from several data bases
originating from NOAA, NIMA, IBCAO, GLOBE, UCSD, USGS, and others.
Etter, P. C., P. J. Lamb, and D. H. Potis. 1987. Heat and freshwater budgets of the Caribbean with
revised estimates of the Central American seas. Journal of Physical Oceanography, 17:1232-
1248.
Food and Agriculture Organization of the United Nations (FAO). 1996. Fisheries and Aquaculture in
Latin America and the Caribbean: Situation and Outlook in 1996. FAO Fisheries Circular No.
921 FIPP/C921. Rome.
Food and Agriculture Organization of the United Nations (FAO). El Riego en Guatemala.
http://www.rlc.fao.org/paises/h2o/guatemala.htm
Food and Agriculture Organization of the United Nations (FAO). El Riego en Honduras.
http://www.rlc.fao.org/paises/h2o/honduras.htm
Fortalecimiento Institucional en Políticas Ambientales. Guatemala, febrero del 2002. Caficultura y
Ambiente: Tendencias, Crisis Actual y Perspectivas del Mercado.
June 2, 2003
130
Abt Associates Inc. / Woods Hole Group
ADT Preliminar
Fratantoni, D.M. 2001. North Atlantic surface circulation during the 1990's observed with satellite-
tracked drifters. Journal of Geophysical Research, 106, 22067-22093.
FUNDARY-ONCA. Plan Maestro Area de Protección Especial Punta de Manabique.
Gallegos, A. 1996. Descriptive physical oceanography of the Caribbean Sea. In, Small Islands: Marine
Science and Sustainable Development, pages 36-55. G. A. Maul, (ed).
Gálvez, E. Fernando Navas. 1996. Caracterizacion Socioeconomica Y Socioproductiva de la Zona
Fronteriza Guatemala Honduras en Torno al Golfo de Honduras. Prepared for Organizacion de
Estados Americanos (OEA). Guatemala.
Gavarrete, Julio and Maria Isabel Fernandez. ECAT: Puertos y Transporte Marítimo. SIECA. Informe
Final, Parte 1: Diagnóstico. Enero 2001.
Global Ballast Water Management Programme. 2000. Global Ballast Water News. Issue 1. April June
2000.
Gonzalez, Candy. Instituto de Derecho Ambiental y Desarrollo Sustenable -IDEADS. Diagnóstico
Nacional Sobre Legislación, Políticas y Marco Institucional para el Manejo del Sistema Arrecifal
del Caribe Mesoamericano (SAM) Belize Case. World Bank Contract No. 7107830.
Gordon, A.L. 1967. Circulation of the Caribbean Sea. Journal of Geophysical Research, 72, 6207-6223.
Greer, J.E. and B. Kjerfve. 1982. Water currents adja cent to Carrie Bow Cay, Belize. Smithsonian
Contributions to Marine Sciences. 12: 53-58.
Guatemala. Consejo Nacional de Áreas Protegidas (CONAP), Oficina Técnica de Seguimiento a la
Estrategia Nacional de Biodiversidad (OTECBIO). 1999. Estrategia Nacional para la
conservación y uso sostenible de la Biodiversidad y Plan de Acción.
Harrison, J., R. Marcus, and A. Weir. 1995. Belize Southern Highway Social Impact Assessment.
Funded by British Development Division in the Caribbean.
Hawkins and Associates Staff. 2002 Honduras Sustainable Coastal Tourism Project. Report 4: Legal
and Regulatory Aspects of Coastal Tourism Development in Honduras. Hawkins & Associates
Inc., Washington DC. Contract No. 7107100. Submitted to: Environmental Sector Management
Unit, Central America Country Management Unit, Latin America and the Caribbean Regional
Office, The World Bank.
Hawkins, D. E. and K. Lamoureux. 2002. Honduras Sustainable Coastal Tourism Project. Report 1: An
Assessment of the Tourism Potential of Honduras: Observations and Recomendations for
Sustainable Coastal Tourism. Hawkins & Associates Inc., Washington DC. Contract No.
7107100. Submitted to: Environmental Sector Management Unit, Central America Country
Management Unit, Latin America and the Caribbean Regional Office, The World Bank.
Hernández-Rodríguez, A., Alceste-Oliviero, C., Sanchez, R., Jory, D., Vidal, L. and L. Constain-Franco.
2000. Aquaculture Development Trends in Latin America and the Caribbean. In R.P.
Subasinghe, P. Bueno, M.J. Phillips, C. Hough, S.E. McGladdery & J.R. Arthur, eds. Aquaculture
in the Third Millennium. Technical Proceedings of the Conference on Aquaculture in the Third
June 2, 2003
131
Abt Associates Inc. / Woods Hole Group
ADT Preliminar
Millennium, Bangkok, Thailand, 20-25 February 2000. pp. 317-340. NACA, Bangkok and FAO,
Rome.
Heyman, W.D. and B. Kjerfve. 2000. The Gulf of Honduras. In: Coastal Ecosystems of Latin America.
U.Seeliger and B.Kjerfve (eds). Elsevier.
Heyman, W.D. and R. Graham (eds.). 2002. La Voz de los Pescadores de la Costa Atlántica de
Guatemala. Una publicación de la Fundación para el Ecodesarrollo de Guatemala, El Toledo
Institute for Development and Environment and la Alianza Tri-Nacional de ONGs para la
Conservación del Golfo de Honduras.
Heyman, W.D. and R. Graham (eds.). 2002. La Voz de los Pescadores de la Costa Atlántica de
Honduras. Una publicación de la Fundación para la Protección de Lancetilla, Punta Sal and
Texiguat, El Toledo Institute for Development and Environment and la Alianza Tri-Nacional de
ONGs para la Conservación del Golfo de Honduras.
Heyman, W.D. and R. Graham (eds.). 2002. The Voice of the Fishermen of Southern Belize. A
publication of the Toledo Institute for Development and Environment and the Trinational
Alliance for the Conservation of the Gulf of Honduras.
Honduras. Secretaria del Despacho de la Presidencia. Instituto Nacional de Estadística. 2001. XVI
Censo de Poblacion y de Vivienda: Censo 2001. Tegucigalpa.
Honduras. Secretaría de Estado en los Despachos de Recurcos Naturales y Ambiente. 2001. Estudio
Sobre Diversidad Biológica de la República de Honduras.
Honduras. Secretaria de Tourismo. 2002. Plan de Acción.
House, Paul, Carlos Cerrato, and Daan Vreughenhil X. 2002. Rationalization of the Protected Areas
System of Honduras: Volume II Biodiversity of Honduras. Financed by PROBAP/World
Bank/UNDP/GEF. Prepared by WICE. Honduras.
HYCOM Consortium for Data Assimilative Modeling program. Ocean Surface Currents: The Caribbean
Current. (http://oceancurrents.rsmas.miami.edu/caribbean/caribbean-cs.html)
Informe Nacional de Desarrollo Humano. Guatemala: Desarrollo Humano, Mujeres y Salud 2002.
INSIVUMEH. 2001. "Calidad del Agua de los Ríos de la Cuenca del Río Maria Linda y Otras Cuencas"
Boletín, No.4. Diciembre.
Instituto Nacional de Bosques (INAB). November 2000, Guatemala Forestal, Número 8.
Instituto Nacional de Bosques (INAB). Ano 2001. Boletin de Estadisticas Forestales 2,000.
Instituto Nacional de Bosques (INAB). Ano 2003. Boletin de Estadisticas Forestales 2,001.
Instituto Nacional de Estadistica Ine Guatemala, C.A. November 2000, Estadisticas Agropecuarias
Continuas 2000, 27,41.
June 2, 2003
132
Abt Associates Inc. / Woods Hole Group
ADT Preliminar
Instituto Nacional de Estadística. Junio, 2002. Encuesta de Granos Basicos: Pronóstico del Ciclo de
Primera (Ańo Agrícola 2002-2003) y Validación del Ciclo de Postrera (Ańo Agrícola 2001-
2002).
Instituto Nacional de Estadística HONDURAS. Noviembre, 2002. Encuesta de Granos Basicos:
Pronóstico del Ciclo de Postrera (Ańo Agrícola 2002-2003) y Validación del Ciclo de Primera
(Ańo Agrícola 2001-2002).
Instituto Nacional de Estadística HONDURAS, Indicadores Básicos Sobre el Desempeńo Agropecuario
1971-2001. Mayo del 2002.
Instituto Nacional de Estadistica. ESTADISTICAS SOBRE EL MEDIO AMBIENTE AŃO 2001,
Guatemala, enero de 2003,37.
Instituto Nacional de Estadistica HONDURAS. Junio 2001. Encuesta Agrícola Nacional 2000-2001.
TOMO I Cultivos Anuales.
Instituto Nacional de Estadistica HONDURAS. Junio 2001. Encuesta Agrícola Nacional 2000-2001.
TOMO II Cultivos Permanentes.
Instituto Nacional de Estadistica HONDURAS. Junio 2001. Encuesta Agrícola Nacional 2000-2001.
TOMO III Ganadería y Otras Especies Animales.
Instituto Nacional de Estadistica HONDURAS. Junio 2001. Encuesta Agrícola Nacional 2000-2001.
TOMO IV Tenencia y Uso de la Tierra, Asistencia Técnica y Crédito Agropecuario.
Instituto Nacional de Sismologia, Vulcanologia, Meteorologia E Hidrologia, Insivumeh, Departamento de
Investigación y Servicios Geofísicos. Volcanes en Guatemala , 1-12.
Instituto Nacional de Sismologia, Vulcanologia, Meteorologia E Hidrologia, Insivumeh, Department de
Investigación y Servicios Geofísicos. Estructura Interna de la Tierra.
Instituto Nacional de Sismologia, Vulcanologia, Meteorologia E Hidrologia, Insivumeh, Marzo de 2003.
Boletín Ambiental No. 3, Climatologia.
Instituto Nacional de Sismologia, Vulcanologia, Meteorologia E Hidrologia, Insivumeh, Department de
Investigac Investigación y Servicios Hidricos, Guatemala, diciembre de 2002. Calidad del Agua
de Los Rios de La Republica de Guatemala, Boletin No. 5.
Instituto Nacional de Sismologia, Vulcanologia, Meteorologia E Hidrologia, Insivumeh, Department de
Investigac Investigación y Servicios Hidricos, Laboratorio de Hidroquimica, Guatemala,
diciembre de 2001. Boletin No. 4.
Instituto Nacional de Sismologia, Vulcanologia, Meteorologia E Hidrologia, Insivumeh, Guatemala,
Marzo de 1998. Boletin Hidrologico No. 16.
Inter-American Development Bank (IADB). 2000. Environmental & Social Technical Assistance
Project: Regional Development Plan for Southern Belize.
Inter-American Development Bank (IADB). Trinational Program for Sustainable Development in the
Upper Lempa River Basin: El Salvador, Guatemala, and Honduras. Loan Proposal CA-0034.
June 2, 2003
133
Abt Associates Inc. / Woods Hole Group
ADT Preliminar
Intra-Americas Seas: Snapshot of the 1/16° Global NLOM SSH and currents Naval Research Laboratory
Real-Time Global Ocean Analysis and Modeling.
(http://www7320.nrlssc.navy.mil/global_nlom/globalnlom/ias.html)
International Tanker Owners Pollution Federation Limited. 2000. Country Profiles; A Summary of Spill
Response Arrangements and Resources Worldwide.
Jacobs, Noel D. 1999. Assessment of Marine and Fisheries Resources in the Southern Region of Belize.
Prepared for Environmental and Social Technical Assistance Project (ESTAP). IADB Project
No. 999/OC-BL.
Kinder, T.H., 1983. Shallow currents in the Caribbean Sea and Gulf of Mexico as observed with satellite-
tracked drifters. Bulletin of Marine Science, 33, 239-246.
Kinder, T.H., G.W. Heburn, and A.W. Green, 1985. Some aspects of the Caribbean circulation. Marine
Geology, 68, 25-52.
Kjerfve, B. 1978. Diurnal energy balance of a Caribbean Barrier reef environment. Bulletin of Marine
Science 28: 137-145.
Kjerfve, B. 1982. Water exchange across the reef crest at Carrie Bow Cay, Belize. Smithsonian
Contributions to Marine Sciences. 12: 59-62.
Kjerfve, B. 1981. Tides of the Caribbean Sea. Journal of Geophysical Research. 86(C-5): 4243-4247.
Koltes, K.H., J.J. Tschirky, and I.C.Feller. Coastal region and small islands: Carrie Bow Cay, Belize. In:
Environment and development in coastal regions and in small islands. UNESCO.
(http://www.unesco.org/csi/pub/papers/koltes.htm).
Kramer, P.A. and P.R. Kramer. 2000. Ecological status of the Mesoamerican Barrier Reef System:
impacts of Hurricane Mitch and 1998 coral bleaching. Final report to the World Bank.
Lee, Michael D., John D. Stednick, and David M. Gilbert. 1995. Environmental Water Quality
Monitoring Program. Final Report. Produced for Department of the Environment, Government
of Belize. Funded by United States Agency for International Development. Tegucigalpa.
Lee, Michael D., John D. Stednick, and David M. Gilbert. 1996. Contamination Assessment in the
Belize National Environmental Water Quality Monitoring Program. Prepared for the Integrated
Management of Surface and Groundwater UCOWR Annual Meeting, 30 July 02 August 1996,
San Antonio, Texas.
Lemay, Michele H. 1998. Coastal and Marine Resources Management in Latin America and the
Caribbean. Technical Study. IADB. Washington, DC.
Maptech BACD 41, BSB 4.0, Yucatan Peninsula to Nicaragua, Including Jamaica and the Cayman
Islands, 4th e.d.
Martínez, Ricardo, Emelie Weitnauer, Daan Vreugdenhil, Paul House. 2002. Rationalisation of the
Protected Areas System of Honduras. Volume 3: Ecotourism. Financed by PROBAP/World
Bank/UNDP/GEF. Prepared by WICE. Honduras.
June 2, 2003
134
Abt Associates Inc. / Woods Hole Group
ADT Preliminar
McField, M. Influence of Disturbance on Coral Reef Community Structure in Belize.
Meerman, J.C. 1999. Review of the Natural Vegetation and Associated Habitats in the Southern Region
of Belize. Funded by Environmental and Social Technical Assistance Project (ESTAP). Belize.
Mendez, M.A. 1994. Mamiferos en Peligro de Extincion en Honduras. Tegucigalpa, Honduras.
Ministry of Natural Resources, Environment, and Industry. Belize National Report to the World Summit
on Sustainable Development. May 2002.
Molinari, R.L., M. Spillane, I. Brooks, D. Atwood, and C. Duckett, 1981. Surface current in the
Caribbean Sea as deduced from Lagrangian observations. Journal of Geophysical Research, 86,
6537-6542.
Mondtero, F.J. 2002. Control of Hydrocarbon Unloading and Oily Wastes from Ships in Honduras Ports.
ATN/SI - 7712 HO. Honduras.
Mooers, C. N. K. and G. A. Maul. 1998. Intra-Americas Sea Circulation. In: The Sea, Vol. 11: The
Global Coastal Ocean - Regional Studies and Syntheses, pages 183-208. A. R. Robinson and K.
H. Brink (eds). Wiley, New York.
Moore, W.S., J.L. Sarmiento, and R.M. Key. 1986. Tracing the Amazon component of surface Atlantic
water using 228 Ra, salinity and silica. Journal of Geophysical Research, 91, 2574-2580.
Murray S.P. and M. Young. 1985. The nearshore current along a high-rainfall, Trade-wind coast -
Nicaragua. Estuarine Coastal & Shelf Science, 21: 687-699.
National Climatic Data Center. 1999. Mitch: The Deadliest Atlantic Hurricane Since 1780.
http://www.ncdc.noaa.gov/oa/reports/mitch/mitch.html
National Research Council. 1989. Using Oil Spill Dispersants on the Sea. Marine Board Commission
on Engineering and Technical Systems Committee on Effectiveness of Oil Spill Dispersants.
National Academy Press. Washington, D.C.
Niklitschek, Edwin J., Mario E. Niklitschek. 2002. Identificación del Programa Manejo Ambiental
Marino-costero en la Costa Norte de Honduras. Valdivia.
NOAA. 2002. Oil Spills in Mangroves, Planning and Response Considerations. Office of Response and
Restoration.
Nunny, Rob, Marcos Santana, Peter Stone, Delia Tillett, and Des Walling. 2001. An Investigation of the
Impact on Reef Environments of Changing Land-use in the Stann Creek District of Belize. The
Watershed Reef Interconnectivity Scientific Study (WRIScs) 1997-2000: Report M3. Belize.
Nunny, Rob, Marcos Santana, Peter Stone, Delia Tillett, and Des Walling. 2001. An Investigation of the
Impact on Reef Environments of Changing Land-use in the Stann Creek District of Belize. The
Watershed Reef Interconnectivity Scientific Study (WRIScs) 1997-2000: Report M4. Methods.
Belize.
June 2, 2003
135
Abt Associates Inc. / Woods Hole Group
ADT Preliminar
Nyusten, J.A. and C.A. Andrade. 1993. Tracking mesoscale ocean features in the Caribbean Sea using
Geosat altimetry. Journal of Geophysical Research, 98, 8389-8394.
Organización de los Estados Americanos (OAS). Diciembre 1998. Plan de Acción Para el Desarrollo
Sostenible de la Zona Fronteriza Guatemala -Honduras en Torno al Golfo de Honduras.
Patuca Foundation. http://geocites.com/RainForest/Canopy/7525/patuca_projects.html.
Perkins, J. S. 1995. Belize Barrier Reef Ecosystem: An Assessment of Resources. The New York
Zoological Society, New York NY, USA, 215 pp.
Platt, S.G. and J.B. Thorbjarnarson. 2000. Status and conservation of the American crocodile,
Crocodylus acutus, in Belize. Biological Conservation 96, 13-20.
Portillo, Rony Gerardo. Fauna de Honduras en Peligro de Extinción. Tegucigalpa, Honduras.
Porting W.H.. 1976. The Climate of Central America. In: Climates of Central and South America. W.
Schwerdtfeger (ed.) Elsevie r. Amsterdam. 532 p.
Port of Belize Limited. 2002. Towards Modernising the Port Industry of Belize Prospectus 2002.
Offering for Sale Relating to Government of Belize Shareholdings in Port of Belize Limited.
Posas, C. and Montoya, D.I. 2002. Honduras Sustainable Coastal Tourism Project. Report 5: Coastal
Municipalities and Sustainable Tourism in Honduras. Hawkins & Associates Inc., Washington
DC. Contract No. 7107100. Submitted to: Environmental Sector Management Unit, Central
America Country Management Unit, Latin America and the Caribbean Regional Office, The
World Bank.
Posford Duvivier Consulting Engineers. 1998. Banana Growers Association - Toledo Port Pre-
Feasibility Study. Interim Report. Financed by the European Commission. Peterborough, UK.
Pratt, L. 2002. Honduras Sustainable Coastal Tourism Project. Report 3: An Environmental Economic
Strategy for Honduras' Coastal Tourism and Protected Areas. Hawkins & Associates Inc.,
Washington DC. Contract No. 7107100. Submitted to: Environmental Sector Management
Unit, Central America Country Management Unit, Latin America and the Caribbean Regional
Office, The World Bank.
Programa Ambiental Regional para Centroamérica (PROARCA). 2002. Protected Areas and
Environmentally Sound Products Component (APM): Progress Report October 2001 March
2002. Cooperative Agreement #596-A-00-01-00116-00.
Programa Ambiental Regional para Centroamérica (PROARCA) / APM. Site Descriptions.
Programa Ambiental Regional para Centroamérica (PROARCA) / COSTAS. 2003. Site Conservation
Plan for the Gulf of Honduras. (Unpublished data).
Programa Ambiental Regional para Centroamérica (PROARCA) / COSTAS. 2002. Seguridad
Ambiental Portuaria y Transporte Marítimo Caso de Estudio de Izabal. Guatemala.
June 2, 2003
136
Abt Associates Inc. / Woods Hole Group
ADT Preliminar
Programa Ambiental Regional para Centroamérica (PROARCA)/COSTAS and Comision
Centroamericana de Transporte Maritimo (COCATRAM). 2002. Plan de Accion de la Agenda
de Seguridad Ambiental Maritimo Portuaria de Centroamérica.
RAMBŘLL Consulting Engineers. 2000. Environmental Efficiency of Maritime Transport Operations in
the Gulf of Honduras. Final Report. Funded by Inter-American Development Bank (IADB.)
Denmark.
Rodriquez, Jose Joaquin and Néstor Jose Windevoxhel. 1998. Regional Analysis of the Situation of the
Coastal Marine Zone Central America. Washington, DC.
Rendón, Julio Cano. Instituto de Derecho Ambiental y Desarrollo Sustenable IDEADS. Diagnóstico
Nacional Sobre Legislación, Políticas y Marco Institucional para el Manejo del Sistema Arrecifal
del Caribe Mesoamericano (SAM) Caso Honduras. World Bank Contract No. 7107830.
República de Guatemala Instituto Nacional de Estadística Censos Nacionales XI de Población y VI de
Habitación 2002. Febrero 2003. Población y Locales de Habitación Particulares Censados
Según Departamento y Municipio (Cifras Definitivas).
República de Honduras Secretaría de Estado en Los Despachos de Recursos Naturales y Ambiente. 2001.
Estudio Sobre Diversidad Biológica de la República de Honduras.
Republica de Honduras Secretaria de Estado en el Despacho Presidencial Instituto Nacional de
Estadística. XVI Censo de Poblacion y V de Vivienda Censo 2001.
República de Honduras Secretaría de Estado en Los Despachos de Recursos Naturales y Ambiente. 2001.
Estrategia Nacional de Biodiversidad y Plan de Acción.
Robles, Raul. Project Report: Informe de Consultas y Entrevistas. March 2003.
Rützler, K., J. D. Ferraris. 1982. Terrestrial environments and climate, Carrie Bow Cay, Belize. In: The
Atlantic Barrier Reef Ecosystem at Carrie Bow Cay, Belize, 1: Structure and Communities
[Smithsonian Contributions to Marine Sciences, Vol. 12, pp 77-91.] K. Rützler and I. G.
Macintyre (eds). Smithsonian Institution, Washington DC, USA, 539 pp.
Salaverría, A. y F. Rosale s. 1993. Ecología pesquera de la costa Atlántica de Guatemala. Evaluación
inicial. Bahía de Amatique Izabal. Informe de Avance, Septiembre, 1993. Centro de Estudios del
Mar y Acuacultura. USAC. 105 p.
Salazar, Ricardo Brown. 1997. Conservation and Sustainable Management of Broad-Leaved Forests on
the North Coast of Honduras. XI World Forestry Congress. Antalya, Turkey.
Sale, Peter F. Capacity Development and Management of Coastal Waters in the Caribbean Region.
Windsor, Canada.
Sale, Peter F., Ernesto A. Chavez, Bruce G. Hatcher, Coling Mayfield, and Jan J. H. Ciborowski.
Guidelines for Developing a Regional Monitoring and Environmental Information System. Final
Report to the World Bank. Prepared for Conservation and Sustainable Use of the MesoAmerican
Barrier Reef System MBRS) in Mexico, Belize, Guatemala, and Honduras. United Nations
University, New York.
June 2, 2003
137
Abt Associates Inc. / Woods Hole Group
ADT Preliminar
Samuels G., 2002. Caribbean Sea Surface Temperature and Wind,
http://www.rsmas.miami.edu/~geoff/carib.html
Secretaría de Integración Económica Centroamericana. 2001. Estudio Centroamericano de Transporte
(ECAT). Informe de Síntesis Plan Maestro de Desarrollo de Transporte Regional 2001-2010.
Sistema de las Naciones Unidas en Guatemala. Guatemala: SNU, 2001. El Financiamiento del
Desarrollo Humano: cuarto informe 2001. A31, A47, A51, A89, A110.
Sistema de las Naciones Unidas en Guatemala. Guatemala: SNU, 2001. Desarrollo Humano, mujeres y
salud : quinto informe 2002, 35, 53, 91, 127, 129-135, 137,257, 323, 351-353, 357, 361, 379,
391, and 399.
Sukhovey, V.F 1980. Hydrology of the Caribbean Sea and Gulf of Mexico. Gidrometeoizdat (ed.).
Leningrad. 182 p.p. (in Russian)
Suarez, Pablo and Dann Sklarew. Perspectives from Latin America and Caribbean Managers.
Inernational Waters: Learning Exchange and Resource Network (IW:Learn). Sept. 2002.
Tetra Tech, Inc., 1993. Regional Monitoring Strategy. Prepared for the San Francisco Estuary Project,
U.S. Environmental Protection Agency. 144 pages.
Tomczak, M. Estaries. 1996.
http://www.es.flinders.edu.au/~mattom/IntroOc/notes/figures/fig12a1.html
Torres, Elvin. Project Report; Informe de Consultas y Entrevistas. Jan 2003.
Tunich-Nah Consultants, Wilderness Group Consultants. June 2000. Report untitled.
United Nations Development Programme (UNDP). 1999. Belize: Country Programme Strategy. Funded
by GEF Small Grants Program
United Nations Development Programme (UNDP). 2002. Informe sobre Desarrollo Humano-
Honduras 2002. Tegucigalpa.
United Nations Environment Programme (UNEP). 1999. Assessment of Land-based Sources and
Activities Affecting the Marine, Coastal, and Associated Freshwater Environment in the Wider
Caribbean Region. UNEP Regional Seas Reports and Studies No. 172. The Hague.
United States Agency for International Development. March 2003. Country Health Statistical Report
Honduras.
United States Environmental Protection Agency. Saving Bays and Estuaries, A primer for Establishing
and Managing Estuary Projects. EPA/503/8-89-001. August 1989.
United States Geologic Survey (USGS). 2001. Coral Reefs in Honduras: Status after Hurricane Mitch.
USGS Open File Report 01-133. http://coastal.er.usgs.gov/publications/ofr/01-133/
United States Geologic Survey. 2002. USGS Hurricane Mitch Program Impacts and Recovery in the
Coastal Environment. http://mitchnts1.cr.usgs.gov/projects/watershrimp.html
June 2, 2003
138
Abt Associates Inc. / Woods Hole Group
ADT Preliminar
United States Geologic Survey (USGS). 2002. Manatee Information Sheet.
http://www.fcsc.usgs.gov/Manatees/Manatee_Sirenia_Project/
United States Geologic Survey (USGS). 2003. USGS Hurricane Mitch Program Impacts and Recovery
to Mangrove and Seagrass.
http://mitchnts1.cr.usgs.gov/projects/seamangrove.html
United States Geologic Survey (USGS). 1999. Digital Atlas of Central America, V. 1 and 2. Data and
resources contributed by: USGS, ESRI, NOAA, NIMA, NASA, SGI, Microsoft, Ingenieria
Gerencial, CIAT, LandInfo, LizardTech, HP, and Motorola.
United States Geologic Survey (USGS). 2001. Digital Atlas of Central and South America, Global GIS
Database, USGS Digital Data Series DDS-62-A, 2001.
United Status Geologic Survey. 2000. Honduras: Diagnóstico de Danos Causados por el Huracán Mitch
a la Infraestrutura Portuaria, 1998. Informe de Acciones a Corto Plazo.
Universidad del Valle de Guatemala, Instituto de Investigaciones. 1998. Determination of
Organochlorine, Organophosphorous and Pyrethroid Pesticidas in Surface and Ground Water
Used for Human Consumption in Guatemala. FAO/IAEA/SIDA.
Visible Earth. Yucatan Peninsula and Gulf of Honduras from MODIS. http://visibleearth.nasa.gov/
Vreugdenhil, Daan, Jan Meerman, Alain Meyrat, Luis Diego Gómez, and Douglas J. Graham. 2002.
Map of the Ecosystems of Central America: Final Report. World Bank, Washington, D.C.
Vreugdenhil, Daan, Paul R. House, Carlos Cerrato, Ricardo Martínez, Ana Cristina Pereira. 2002.
Rationalisation of the Protected Areas System of Honduras. Volume 1: Main Study. Financed
by PROBAP/World Bank/UNDP/GEF. Prepared by WICE. Honduras.
Watershed Reef Interconnectivity Scientific Study. Belize 1997 - 2001 Report E1v1.
(www.ims.plymouth.ac.uk/geomatics/wriscs/pubs/)
World Bank. February 20, 2003. Poverty in Guatemala Report No. 24221-GU.
World Bank. Environmentally and Socially Sustainable Development Central American Department
Latin America and the Caribbean Regional Office. 2001. Project Appraisal Document on a
Proposed Project for US$15.2 Million, Including a Grant from the Global Environmental Facility
Trust Fund in the Amount of US$11.0 Million Equivalent to the Central American Commission
on Environment and Development for a Regional Project for the Conservation and Sustainable
Use of the MesoAmerican Barrier Reef System (MBRS).
World Bank. 2001. Honduras Poverty Diagnostic. Report No. 20531-HO. Poverty Reduction and
Economic Management Sector Unit Latin America and Caribbean Region.
World Bank. 2001. Project Appraisal Document on a Proposed Credit in the Amount of SDR 4.0 Million
(US$5.0 Million Equivalent) to the Republic of Honduras for a Sustainable Coastal Tourism
Project. Report No: 22604-HO.
World Bank and CCAD. 2001. Ecosystems of Central America (ArcView regional map files at
1:250,000). World Bank, Comisión Centroamericana de Ambiente y Desarrollo (CCAD), World
June 2, 2003
139
Abt Associates Inc. / Woods Hole Group
ADT Preliminar
Institute for Conservation and Environment (WICE), and the Centro Agronómico Tropical de
Investigación y Enseńanza (CATIE), Washington, D.C. (http://www.worldbank.org/ca-env)
World Bank. Project Appraisal Document on a Proposed Project for US $15.2 Million, including a grant
from the Global Environmental Facility Trust Fund in the amount equivalent to the Central
American Commission on Environment and Development for a Regional Project for the
Conservation and Sustainable Use of the Mesoamerican Barrier Reef System (MBRS). April 5,
2001.
Wust, G., 1964. Stratification and Circulation in the Atillean-Caribbean Basins. Columbia University
Press. Palisades, NY, 201 pp.
Yańez-Arancibia, Alejandro, D. Zárate Lomelí, M. Gómez Cruz, R. Godínez Orantes, V. Santiago
Fandińo. 1998. The Ecosystem Framework for Planning and Management the Atlantic Coast of
Guatemala. Ocean & Coastal Management 42, 283-317.
Yańez-Arancibia, Ale jandro, D. Zárate Lomelí and Angel Terán Cuevas. 1993. Evaluacion del Potencial
y Cobertura de Manglares y Pastos Marinos, Problemática Ambiental, Prospección de Recurcos
Pesqueros, y Definición de Pautas de Manejo para la Costa Atlantica de Guatemala. Programa de
las Naciones Unidas para el Medioambiente, Programa Ambiental del Caribe Unidad de
Coordinación Regional. Programa de Ecología, Pesquerías y Oceanografía del Golfo de México
(EPOMEX).
Yańez-Arancibia, Alejandro, David J. Zárate Lomeli, and Angel Terán Cuevas. 1994. Evaluation of the
Coastal and Marine Resources of the Atlantic Coast of Guatemala. Funded by UNEP Caribbean
Environment Programme, Kingston, Jamaica. CEP Technical Report No. 34 1995, 64 pp.
Yańez-Arancibia, Alejandro, A.L. Lara-Domínguez, J.L. Rojas Galaviz, D.J. Zárate Lomeli, G.J.
Villalobos Zapata, P. Sánchez-Gil. 1999. Integrating Science and Management on Coastal
Marine Protected Areas in the Southern Gulf of Mexico. Ocean & Coastal Management 42, 319-
344.
June 2, 2003
140
Appendix A
List of Abbreviations
A1
Abt Associates Inc. / Woods Hole Group
ADT Preliminar
AAIW
Antarctic Intermediate Water
ACDI
Canadian Agency for International Development
ALIDES
Alliance for Sustainable Development
(La Alianza para el Desarrollo Sostenible)
CAPAS
Consolidation of the Central American Protected Areas System
CESSCO
Centro de Estudios y Contaminantes
CEP
Caribbean Environment Programme
CCAD
Central American Commission for Environment and Development
(Comision Centroamericana de Ambiente y Desarrollo)
CIDI
Ingter-American Council for Integral Development
COBIGUA
Compańía Bananera Independiente de Guatemala S.A.
COCATRAM
Comision Centroamericana de Transporte Marítimo
COLREG
Collision Regulations
CONAMA
Comision Nacional del Medio Ambiente
CONAP
National Council of Protected Areas
COPRE
Commission for the Reform of the State of Guatemala Decentralization
and Public Participation
CSO
Central Statistical Office
CZMAI
Coastal Zone Management Authority and Institute
DGMM
Merchant Marines (Direción Nacional del Mercante Marina)
DMSP
U.S. Defense Meteorological Satellite Program
DO
Dissolved Oxygen
EIA
Environmental Impact Assessment
EMPORNAC
Empresa Portuaria Nacional
ENP
Empresa Nacional Portuaria
EPOMEX
Programa de Ecología, Pesquerías y Oceanografía del Golfo de México
EQO
Environmental Quality Objective
FAO
Food and Agriculture Organization of the United Nations
FUNDARY
Fundación para la Conservación del Medio Ambiente y de los Recursos
Naturales
GEF
Global Environment Facility
GDP
Gross Domestic Product
GIWA
Global International Waters Assessment
GPCP
Global Precipitation Climatology Project
HDR
Human Development Report
IADB
Inter-American Development Bank
IALA
International Association of Lighthouse Authorities
IMDG
International Maritime Dangerous Goods
IMO
International Maritime Organization
INGUAT
Guatemalan Institute of Tourism
IPC
Inter-American Port Commission
ISP
Inter-American Strategy for Public Participation in Sustainable
Development Decision-making
ITCZ
Intertropical Convergence Zone
LNG
Liquid Natural Gas
MARPOL
International Convention for the Prevention of Pollution from Ships
MBRS
MesoAmerican Barrier Reef System
MODIS
Moderate Resolution Imaging Spectrorodiometer
MICIVI
Ministry of Communications, Infrastructure and Housing
MPPI
Major Perceived Problem and Issue
MOU
Memorandum of Understanding
A2
Abt Associates Inc. / Woods Hole Group
ADT Preliminar
NAP
National Action Plan
NGO
Non-governmental Organization
NOAA
National Oceanic and Atmospheric Administration
NRC
National Research Council
NRSP
Northeast Regional Seas Program
OAS
Organization of American States
OIRSA
Regional Office for Agriculture and Livestock Sanitation
PDF
Project Development Facility
PROARCA
Programa Ambiental Regional Para Centroamerica
RAMSAR
International Convention on Wetlands
RAP
Rapid Assessment of Point Sources and Non-Point Sources
SAP
Strategic Action Programme
SENA
Secretaria Nacional del Ambiente
SERNA
Secretaria de Recursos Naturales y Ambiente
SICA
Central American Integration System
(Sistema de la Integración Centroamericana)
SIECA
Secretaría de Integración Económica Centroamericana
SIGMA
Environmental Management Systems
SINEIA
National System of Environmental Impact Assessment
(Sistema Nacional de Evaluación de Impacto Ambiental)
SOLAS
Safety of Life at Sea
SOPTRAVI
Ministry of Public Works, Transportation and Housing
(Secretaria de Estado de Obras Publicas, Transporte y Vivienda)
SSM/I
Special Sensor Microwave Imager
SST
Sea-Surface Temperatures
SUW
Subtropical UnderWater
TAG
Technical Advisory Groups
TDA
Transboundary Diagnostic Analysis
TIDE
Toledo Institute for Development and the Environment
TRIGOH
Trinational Alliance for the Conservation of the Gulf of Honduras
UML
Upper Mixed Layer
UNDP
United Nations Development Programme
UNEP
United Nations Environment Programme
UNESCO
United Nations Educational, Scientific and Cultural Organization
USAID
United States Agency for International Development
USGS
U.S. Geological Survey
VTS
Vessel Tracking System
WCMC
World Conservation Monitoring Centre
WCRP
World Climate Research Program
WNACW
Western North Atlantic Central Water
WRIScS
Watershed Reef Interconnectivity Scientific Study
WWF
World Wildlife Fund
ZOLIC
Industrial and Commercial Free Zone
A3
Abt Associates Inc. / Woods Hole Group
ADT Preliminar
Appendix B
Causal Chain Analysis
B1
Abt Associates Inc. / Woods Hole Group
ADT Preliminar
Degradation of Coastal and Marine Ecosystems
Degradation of Coastal and Marine Ecosystems
Existing and Future Port Operations
Marine Activities
Other Land-Based Activities
Port Expansion and
Oil and Chemical Discharge
Agriculture
Maintenance Activities
Loading/Offloading and
Other Marine Activities
Logging
Storage of Cargo
Port-Related Industry
Municipal Sewage
Discharge
Waste Generation
Aquaculture
and Handling
Ballast Water
Tourism
Industrial Discharge
B2
Abt Associates Inc. / Woods Hole Group
ADT Preliminar
Existing and Future Port Operations
Existing and Future Port Operations
Port Expansion and
Loading/Offloading
Port-Related Industry
Waste Generation
Ballast Water
Maintenance Activities
and
and Handling
Storage of Cargo
Dredging
Infrastructure
Inadequate
Legal/Regulatory
Inadequate
Inadequate
Investment
*EIA
Investment
Investment
*Audit
*Monitoring/Enforcement
Lack of
Lack of
Lack of
Legal/Regulatory
Legal/Regulatory
Capacity
Capacity
Capacity
*EIA
*EIA
*Monitoring/Enforcement
*ICZM
Legal/Regulatory
Legal/Regulatory
Legal/Regulatory
*EIA
*Standards
*Standards
*Audit
*Monitoring/Enforcement
*Monitoring/Enforcement
*Monitoring/Enforcement
B3
Abt Associates Inc. / Woods Hole Group
ADT Preliminar
Marine Activities Oil and Chemical Discharge
Marine Activities
Oil and Chemical Discharge
Other Marine Activities
Collision
Vessel
Dispersant
Discharge
Usage
Traffic
Intensity
Legal/Regulatory
Inadequate
*Standards
Training
*Monitoring/Enforcement
and
Usage
Legal/Regulatory
Inadequate Investment
Legal/Regulatory
*Operating
*EIA
Monitoring System
*Monitoring/Enforcement
*Warning System
Inadequate
Bad
Navigational
Weather
Aids
Inadequate
National Policy
Investment
Legal/Regulatory
Training
*Standards/Regulations
Legal/Regulatory
Inadequate Investment
*Minimum
Training Standards
Inadequate
Vessel
Standards
Legal/Regulatory
Legal/Regulatory
*National and Regional
*Monitoring/
Policies
Enforcement
Terrorism
B4
Abt Associates Inc. / Woods Hole Group
ADT Preliminar
Marine Activities Other Marine Activities
Marine Activities
Oil and Chemical Discharge
Other Marine Activities
Fishing
Anchoring
Marine
Collections
Legal/Regulatory
Legal/Regulatory
Legal/Regulatory
*Monitoring/Enforcement
*Monitoring/Enforcement
*Monitoring/Enforcement
National and
National and
National and
Regional Policies
Regional Policies
Regional Policies
Education
Education
Education
Scientific Capacity
Scientific Capacity
and
and
Knowledge
Knowledge
B5
Appendix C
Supplementary Data
C1
C. 1. Belizean Ports Export/Import Summary (metric tons), 1996-2001
Belize City
1996
1997
1998
1999
2000
2001
Cargo
Sub-type
Import
Export
Import
Export
Import
Export
Import
Export
Import
Export
Import
Export
Hazardous
93,117
0
104,620
0
132,103
0
178,549
0
159,943
0
187,364
0
Petroleum
92,758
0
104,430
0
131,910
0
178,170
0
159,773
0
187,352
0
Non-Petroleum
359
0
191
0
193
0
378
0
170
0
12
0
Non-Hazardous
183,666
172,595
198,491
183,988
209,558
162,789
233,997
165,861
294,292
156,270
339,433
178,040
Banana
0
0
0
0
0
0
0
0
0
0
0
0
Non-Banana
183,666
172,595
198,491
183,988
209,558
162,789
233,997
165,861
294,292
156,270
339,433
178,040
Total
276,783
172,595
303,111
183,988
341,661
162,789
412,546
165,861
454,235
156,270
526,797
178,040
Big Creek
Hazardous
0
0
0
0
0
0
0
0
0
0
0
0
Petroleum
0
0
0
0
0
0
0
0
0
0
0
0
Non-Petroleum
0
0
0
0
0
0
0
0
0
0
0
0
Non-Hazardous
1,180
64,688
0
57,744
1,179
56,404
2,723
61,434
49,184
85,437
33,739
56,493
Banana
0
57,925
0
53,622
0
51,648
0
57,631
0
66,686
0
45,140
Non-Banana
1,180
6,763
0
4,122
1,179
4,756
2,723
3,803
49,184
18,751
33,739
11,354
Total
1,180
64,688
0
57,744
1,179
56,404
2,723
61,434
49,184
85,437
33,739
56,493
Commerce Bight
Hazardous
0
0
0
0
0
0
0
0
0
0
0
0
Petroleum
0
0
0
0
0
0
0
0
0
0
0
0
Non-Petroleum
0
0
0
0
0
0
0
0
0
0
0
0
Non-Hazardous
0
18,106
0
28,663
0
29,137
0
32,987
0
26,226
462
16,791
Banana
0
0
0
0
0
0
0
0
0
0
0
0
Non-Banana
0
18,106
0
28,663
0
29,137
0
32,987
0
26,226
462
16,791
Total
0
18,106
0
28,663
0
29,137
0
32,987
0
26,226
462
16,791
All Ports
1996
1997
1998
1999
2000
2001 % growth 1996-2001
Hazardous
93,117
104,620
132,103
178,549
159,943
187,364
15.0%
Petroleum
92,758
104,430
131,910
178,170
159,773
187,352
15.1%
Non-Petroleum
359
191
193
378
170
12
-49.5%
Non-Hazardous
440,235
468,886
459,068
497,000
611,409
624,958
7.3%
Banana
57,925
53,622
51,648
57,631
66,686
45,140
-4.9%
Non-Banana
382,310
415,264
407,420
439,370
544,723
579,819
8.7%
Total
533,352
573,506
591,171
675,549
771,352
812,322
8.8%
Source: Port of Belize Limited (2002) Offer for Sale Relating to Government of Belize Shareholdings in Port of Belize Limited.
Offering Memorandum. January. Note that the data for 2001 apparently are only for the first nine months of the year (see page 3 of report).
C2
C. 2 Belize City Port Cargo Import/Export Statistics (short tons), 1996 - 2002
1996
1997
1998
199
2000
2001
2002
Short/tons
Short/tons
Short/tons
Short/tons
Short/tons
Short/tons
Short/tons
Description
Hazardous
Import
Export
Import
Export
Import
Export
Import
Export Import Export Import Export
Import
Export
N.C.S. Containers
No
7,182
1,830
17,521
9,673
18,736
9,907
34,599 15,811 66,380
20,405
58,426
15,570 n/a
n/a
Container Lo Co
No
144,655
12,523
146,687
17,223
149,264
13,311
167,171 13,353 190,962
14,161 252,313
32,347
232,202 29,003
Break Bulk
No
8,421
3,199
11,024
1,163
17,828
647
5,419
770 5,773
1
6,893
60
870
3
Break Bulk/Poles
No
0
0
0
0
0
0
0
0
0
0
1,147
0
0
0
Fuel
Yes
102,246
0
115,112
0
142,433
0
191,816
0 174,504
0 206,359
0
163,920
0
Fertilizer
No
14,794
0
18,823
0
15,296
0
20,543
0 8,399
0
9,646
0
9,522
0
Wheat
No
24,472
0
21,892
0
23,904
0
14,949
0 24,682
0
23,953
0
23,122
0
Insecticides
Yes
326
0
129
0
186
0
273
0
176
0
0
0
0
0
Butane
Yes
0
0
0
0
2,970
0
4,580
0 1,613
0
158
0
0
0
Cement
No
0
0
0
0
235
0
10,817
0 17,515
0
7,598
0
5,111
0
Sugar
No
0
105,368
0
121,594
0
110,606
0 110,255
0 100,252
0 112,278
0 108,932
Explosives
Yes
70
0
81
0
27
0
144
0
11
0
13
0
0
0
Molasses
No
0
64,738
0
52,163
0
43,647
0 40,895
0
37,436
0
34,977
0 32,593
Steel
No
2,928
0
2,848
0
5,731
0
4,435
0 10,685
0
14,179
0
13,175
0
Dolomite P.G.
No
2
2,592
0
993
0
1,323
0
1,743
0
0
0
1,020 n/a
n/a
Total
305,096
190,250
334,117
202,809
376,610
179,441
454,746 182,827 500,700 172,255 580,685 196,252
Source: Port of Belize Limited (2002) Offer for Sale Relating to Government of Belize Shareholdings in Port of Belize Limited.
Offering Memorandum. January. Note that the data for 2001 apparently are only for the first nine months of the year (see page 3 of report).
The 2001 numbers were supplemented with those from the electronic file from the port.
The additional 2001 data do not have N.C.S. Containers and Dolomite P.G., so the data in this summary just
reflects the first nine months of the year for these two
categories.
C3
C. 3 Big Creek Port Cargo Import/Export Statistics (short tons), 1996 2002
1996
1997
1998
199
2000
2001
1996-2001
Short/tons
Short/tons
Short/tons
Short/tons
Short/tons
Short/tons
Description
Hazardous
Import
Export
Import
Export
Import
Export
Import
Export
Import Export Import Export Total
Container B.C.
No
0
0
0
0
0
0
0
0 38,027
76025,664
448
64,899
Break Bulk B.C.
No
0
0
0
0
0
0
0
0 4,294 1,671 3,693
67
9,725
Bananas B.C.
No
0
63,850
0
59,107
0
56,931
0
63,526
073,508
0 49,757
366,679
Concentrate B.C.
No
0
0
0
0
0
0
0
0
015,315
0 10,007
25,322
Fertilizer B.C.
No
0
0
0
0
0
0
0
0 4,674
0 3,632
0
8,306
Pine Stumps B.C.
No
0
7,455
0
4,544
0
5,243
0
4,192
0 2,923
0 1,993
26,350
Feed B.C.
No
1,301
0
0
0
1,300
0
3,001
0 7,220
0 4,201
0
17,023
Total
1,301
71,305
0
63,651
1,300
62,174
3,001
67,718 54,21594,17737,19062,272
518,304
Source: Port of Belize Limited (2002) Offer for Sale Relating to Government of Belize Shareholdings in Port of Belize Limited.
Offering Memorandum. January. Note that the data for 2001 apparently are only for the first nine months of the year
C4
C. 4. Belize City Port Ship Calls, 1996 September 2001
1996
1997
1998
199
2000
2001 Total
N.C.S. Containers
15
25
24
31
52
52
199
Container Lo Co
127
118
92
104
85
61
587
Break Bulk
9
11
18
12
7
9
66
Break Bulk/Poles
0
0
0
0
0
1
1
Fuel
15
12
17
29
25
25
123
Fertilizer
19
18
13
15
4
3
72
Wheat
8
7
8
5
8
6
42
Insecticides
14
3
1
0
3
0
21
Butane
0
0
8
13
4
1
26
Cement
0
0
1
13
14
14
42
Sugar
10
12
15
13
10
10
70
Explosives
2
3
4
7
1
1
18
Molasses
8
9
5
5
5
5
37
Steel
2
2
3
3
5
6
21
Dolomite P.G.
2
1
1
2
0
2
8
Total
231
221
210
252
223
196
1,333
Source: Port of Belize Limited (2002) Offer for Sale Relating to Government of Belize Shareholdings in Port of Belize Limited.
C5
C. 5. Big Creek Port Ship Calls, 1996 September 2001
1996
1997
1998
199
2000
2001 Total
Container B.C.
0
0
0
0
28
19
47
Break Bulk B.C.
0
0
0
0
10
7
17
Bananas B.C.
49
52
52
52
52
39
296
Concentrate B.C.
0
0
0
0
1
3
4
Fertilizer B.C.
0
0
0
0
7
5
12
Pine Stumps B.C.
4
4
5
4
3
2
22
Feed B.C.
1
0
1
2
4
2
10
Total
54
56
58
58
105
77
408
Source: Port of Belize Limited (2002) Offer for Sale Relating to Government of Belize Shareholdings in Port of Belize Limited.
C6
·
C 6. Santo Tomás de Castilla and Puerto Barrios Export/Import Summary (Metric Tons), 1993-2002
Santo Tomás de
Imports
Castilla
Cargo
Sub-type
1993
1994
1995
1996
1997
1998
1999
2000
2001
2002
Hazardous
572,645
661,528
662,599
666,161
713,210
817,470
837,033
773,062
951,719
870,687
Petroleum 446,934
504,288
554,868
527,970
551,528
644,085
640,386
559,676
636,519
619,898
Non-
125,711
157,241
137,731
138,192
161,682
173,384
196,647
213,386
315,200
250,790
Petroleum
Non-
828,216
859,192
848,546
792,876
938,199
1,311,572
1,250,647
1,304,256
1,149,010
1,415,081
Hazardous
Banana
1,255
107
0
396
0
118
0
147
0
0
Non-
826,961
859,085
848,546
792,480
938,199
1,311,454
1,250,647
1,304,109
1,149,010
1,415,081
Banana
Total
1,400,861
1,520,720
1,541,145
1,459,037
1,651,409
2,129,042
2,087,680
2,077,318
2,100,729
2,285,768
Exports
Cargo
Sub-type
1993
1994
1995
1996
1997
1998
1999
2000
2001
2002
Hazardous
352,914
297,597
458,313
748,708
1,309
3,338
2,740
3,265
1,091,060
1,336,847
Petroleum 346,753
287,602
448,234
730,637
972
562
986
55
1,066,601
1,302,459
Non-
6,161
9,995
10,079
18,071
336
2,776
1,754
3,211
24,459
34,389
Petroleum
Non-
776,320
820,868
836,490
978,205
2,122,658
2,304,629
2,165,095
2,269,113
1053,329
1,177,412
Hazardous
Banana
230,494
275,038
284,051
326,272
15,697
18,949
23,413
14,574
213,915
238,756
Non-
545,826
545,829
552,439
651,932
2,106,961
2,285,680
2,141,681
2,254,539
839,414
938,655
Banana
Total
1,129,234
1,118,465
1,294,803
1,726,912
2,123,966
2,307,967
2,167,834
2,272,379
2,144,389
2,514,259
Imports and Exports
C7
%
Santo Tomás de
1993
1994
1995
1996
1997
1998
1999
2000
2001
2002
growth
Castilla
1993-
2002
Hazardous
925,560
959,125
1,150,912
1,414,869
714,519
820,808
839,773
776,327
2,042,779
2,207,535
9.1%
Petroleum 793,687
791,890
1,003,103
1,258,607
552,500
644,647
641,372
559,730
1,703,120
1,922,357
9.2%
Non-
131,873
167,235
147,810
156,262
162,019
76,160
198,401
216,597
339,659
285,178
8.0%
Petroleum
Non-
1,604,536
1,680,059
1,685,036
1,771,080
3,060,857
3,616,201
3,415,742
3,573,369
2,303,339
2,592,493
4.9%
Hazardous
Banana
231,749
275,145
284,051
326,669
15,697
19,068
23,413
14,721
213,915
238,756
0.3%
Non-
1,372,787
1,404,914
1,400,985
1,444,412
3,045,160
3,597,134
3,392,328
3,558,648
1,988,424
2,353,736
5.5%
Banana
2002
Puerto
Imports
Exports
Imp/Exp
Barrios
Hazardous
171,646
0
171,646
Petroleum
171,646
0
171,646
Non-
0
0
0
Petroleum
Non-
232,997
948,470
1,181,467
Hazardous
Banana
0
614,891
614,891
Non-
232,997
333,578
566,575
Banana
Total
404,643
948,470
1,353,113
C8
C. 7. Puerto Santo Tomás de Castilla Import Statistics (Metric Tons), 1993 - 2002
Type
Hazardous
1993
1994
1995
1996
1997
1,998
1999
2000
2001
2002
ABONOS
No
5,711
5,510
9,902
7,923
11,265
94,318
118,988
88,240
16,817
15,504
ACEITES,GRASA VEGETAL Y ANIMAL
No
50,136
46,672
60,542
50,133
49,701
60,825
63,818
75,258
73,354
75,104
AJONJOLI
No
3,544
1,143
693
1,619
3,676
33
0
ALGODON INCLUYE BORRA
No
17,807
22,186
26,959
23,273
41,104
64,372
14,143
27,785
19,120
18,153
ARCILLA *
No
2,911
3,183
1,144
4,161
1,252
1,636
2,436
4,505
3,437
4,346
ARENA QUIMICA
No
183
119
92
40
42
20
81
146
110
331
ARROZ
No
15,780
11,352
10,962
14,997
4,260
4,327
9,451
6,170
5,245
6,380
ASBESTOS
No
250
1,342
818
4
380
858
221
163
0
ASFALTO
No
8,799
3,744
4,597
4,470
1,049
281
9,327
4,406
13,035
4,283
AUTOBUSES
No
1,321
1,510
1,565
1,727
1,277
913
859
915
914
AVENA
No
186
49
104
1,306
996
236
159
AZUCAR Y DERIVADOS
No
145
77
36
30
160
21
192
72
60
40
BANANOS
No
1,255
107
396
118
147
0
0
BARRO, LOZA, PORCELANA Y VIDRIO
No
19,003
17,558
13,835
12,404
14,150
13,763
19,147
19,919
24,101
22,341
BEBIDAS ALCOHOLICAS O ARTIF.
No
5,767
5,465
5,268
4,951
5,223
5,397
8,262
6,775
8,872
7,511
BUNKER
Yes
25,197
28,750
53,022
BICICLETAS
No
11
45
102
178
183
CACAO
No
15
21
14
24
28
21
10
16
CAFE EN GRANO
No
20
3
20
183
20
535
73
CAMARONES, LANGOSTAS
No
29
228
232
71
67
90
71
102
1,042
62
CAMIONES
No
2,733
4,131
1,887
2,920
5,489
2,674
2,833
5,479
2,596
CAŃA DE IZOTE
No
16
140
0
CAOLIN
No
100
76
113
487
394
121
20
102
CARBON
No
1,164
1,711
328
477
1,337
73,609
53,894
145,023
32,243 144,138
CARDAMOMO
No
11
30
CARNES
No
3,451
796
1,152
588
1,081
1,723
3,710
1,604
1,568
1,294
CEMENTO, CAL, YESO
No
2,869
6,484
4,720
2,503
1,341
1,744
909
1,144
1,712
2,334
CERAMICA
No
6,062
13,355
15,935
11,098
23,249
39,006
23,714
36,076
45,137
56,640
CHASISES PARA CONT. Y FURG.
No
1,741
709
387
1,322
305
383
477
685
868
C9
Type
Hazardous
1993
1994
1995
1996
1997
1998
1999
2000
2001
2002
CINCHONA (QUINA)
No
21
CONCRETO Y OTROS
No
2,488
2,454
1,161
1,856
1,349
8,677
5,676
246
140
258
DESPERDICIO DE PAPEL
No
362
2,853
4,956
9,942
9,529
11,112
18,397
DIESEL Y OTROS ACEITES COMBUST.
Yes
196,623
220,551
220,230
192,658
169,810
249,074
196,925
178,674
185,352 162,527
ELECTRONICOS PARA MAQUILA
No
41
30
1,043
1,486
ESPECIES
No
1,333
217
362
627
536
351
501
863
448
1,324
FIBRAS SINTETICAS, TEXTILES
No
3,242
6,366
5,268
8,626
5,078
6,376
6,384
6,427
3,653
3,294
FIBRAS Y RESINAS SINTETICAS
No
6,065
FRIJOL EN GRANOS
No
8,030
974
1,702
390
1,623
4,533
4,035
3,626
4,242
6,445
FRUTAS
No
2,008
565
2,306
920
172
83
423
93
312
317
GAS BUTANO
Yes
1,351
829
2,121
17,459
9,359
232
GAS NATURAL
Yes
GAS PROPANO
Yes
17,821
30,625
54,588
80,171
54,662
46,798
57,846
45,220
64,661
96,037
GASOLINA
Yes
159,271
184,985
230,316
211,973
248,292
256,322
286,653
227,585
307,232 269,985
GOMA DE MASCAR
No
536
1,027
837
477
767
730
612
1,379
507
465
GRANOS BASICOS
No
247
340
0
0
3
0
0
HARINA
No
5,039
2,759
2,483
915
1,587
2,496
3,651
3,699
484
2,432
HENEQUEN
No
300
0
0
0
161
46
HORTALIZAS
No
89
109
40
153
394
93
725
277
92
595
HULE NATURAL SIN PROCESO
No
163
258
372
137
19
21
17
81
847
283
KEROSSENE
Yes
26,071
28,839
12,272
6,626
5,721
5,486
3,927
4,600
3,488
2,455
JUEGOS MECANICOS
No
699
67
LANCHAS Y MOTOS ACUATICAS
No
2
52
18
63
44
63
64
LECHE
No
16,723
18,314
17,055
15,779
17,180
15,510
8,264
6,798
9,948
29,184
LIMON SECO
No
0
0
16
0
0
0
MADERA ASERRADA
No
733
1,103
285
260
640
2,660
5,921
6,889
15,757
11,449
MAIZ
No
22,149
26,965
14,633
10,969
7,935
3,885
16,861
13,379
13,859
10,622
MALTA
No
2,470
7,749
9,371
8,030
5,384
7,028
264
17
92
44
MAQUINARIA Y EQUIPO
No
25,568
24,105
19,634
15,686
27,287
30,964
20,564
15,096
18,851
19,670
MARMOL
No
254
96
84
233
482
589
MATERIAL DE TRANSPORTE
No
643
744
172
219
233
206
500
313
252
624
MELON
No
22
13
60
19
0
0
0
C10
Type
Hazardous
1993
1994
1995
1996
1997
1998
1999
2000
2001
2002
MENAJE DE CASA EFEC.PERSONALES
No
2,320
2,306
2,166
2,825
3,243
2,449
2,393
1,621
2,490
3,229
MIEL DE ABEJA
No
86
7
0
0
0
0
84
MINERALES METALICOS
No
688
19
84
141
1,186
63
0
MOTOCICLETAS
No
17
180
108
153
337
669
MUEBLES DE MADERA
No
350
391
562
409
1,270
1,749
3,176
2,657
3,625
4,950
NEUMATICOS
No
1,792
11,254
12,666
10,369
11,614
12,336
13,827
NIQUEL
No
1
4
46
NUEZ
No
2
2
12
20
42
OTRAS INDUSTRIAS
No
56,648
62,696
53,861
36,887
43,918
62,740
40,214
37,229
31,707
21,645
OTRAS SEMILLAS
No
705
436
217
1,327
291
1,799
835
1,243
786
476
OTROS ALIMENTOS
No
20,615
21,935
20,063
27,414
36,888
42,626
55,863
61,751
81,352 100,519
OTROS ANIMALES VIVOS
No
46
OTROS DESTILADOS DEL PETROLEO
Yes
45,744
39,252
36,583
34,404
73,027
68,946
85,677
78,398
46,259
35,641
OTROS MINERALES
No
19
137
136
130
23
201
415
5,666
251
232
OTROS PRODUCTOS AGRICOLAS
No
226
146
269
9
34
26
0
10
OTROS PRODUCTOS METALICOS
No
38,642
36,015
34,578
38,152
50,965
45,291
41,048
41,779
43,613
49,723
OTROS PRODUCTOS PARA MAQUILA
No
66
24
51
35
33
19
3,496
OTROS PRODUCTOS QUIMICOS
Yes
117,394
146,045
120,307
119,276
144,978
155,620
178,243
198,722
298,487 237,276
PALETAS VACIAS
No
2,838
3,133
2,516
25
0
0
PAPEL, PROD. DE PAPEL, IMPRESOS
No
167,720
167,660
154,207
132,556
141,136
165,114
188,420
179,540
175,396 188,738
PESCADOS, OTRAS, ALMEJAS
No
186
115
47
48
14
110
114
72
PETROLEO CRUDO
Yes
52
36
50
17
16
777
0
PIEDRAS POMEZ
No
18
0
0
19
27
45
PIEZAS DE CORREO
No
108
132
81
95
187
80
54
66
36
70
PLAGUICIDAS
Si
7,838
7,220
10,061
10,340
10,832
12,154
10,975
11,504
13,680
11,507
PLATANOS
No
0
0
0
21
0
PLAYWOOD
No
0
406
1,114
673
650
463
1,822
POLLO CONGELADO
No
9,148
9,152
8,014
2,118
4,118
4,689
4,559
4,090
6,031
10,152
PROD. DE ASBESTOS Y FIBROCEMENTO
No
1
1,750
400
215
961
738
1,851
4,030
5,671
PROD. DE MADERA EXCEPTO MUEBLE
No
5,830
8,296
6,162
6,293
2,204
3,290
1,190
5,496
2,355
4,411
PROD. ELECTRICOS Y ELECTRONICOS
No
17,257
23,319
26,045
26,395
28,246
46,331
31,846
33,130
35,065
42,083
PROD. FARMACEUTICOS, MEDICAMENTO No
1,847
15,002
2,282
2,089
3,198
2,995
1,521
2,641
4,123
4,207
C11
Type
Hazardous
1993
1994
1995
1996
1997
1998
1999
2000
2001
2002
PROD. METALICOS ESTRUCTURALES
No
6,265
3,720
5,256
4,474
4,195
5,247
4,366
11,725
3,442
1,283
PROD. Y EQUIPO DE OFICINA
No
411
1,394
1,680
2,292
1,814
2,035
1,490
PROD. Y MATERIAL REFRACTORIO
No
66
3,143
2,568
893
1,483
2,766
1,143
PRODUCTOS DE CAUCHO
No
11,825
11,566
13,542
13,129
6,744
6,623
5,786
5,037
4,298
3,722
PRODUCTOS DE MARMOL
No
134
187
87
89
5
0
PRODUCTOS DE PESCA - SIN PROCESO
No
0
0
0
0
6
PRODUCTOS DE SILVICULTURA
No
32
281
174
261
381
309
379
1,432
2,975
2,099
PRODUCTOS DE TABACO
No
9
154
28
106
33
459
457
109
558
697
PRODUCTOS METALICOS BASICOS
No
39,893
41,906
66,803
53,729
63,160
136,495
84,162
26,057
14,092
17,871
PRODUCTOS PLASTICOS
No
8,260
15,847
14,048
12,418
13,990
14,924
20,583
20,198
26,884
32,940
PULPA DE MADERA
No
8,730
3,684
6,352
4,141
9,434
6,718
6,184
6,198
5,326
6,165
RASTRA VACIA
No
7
23
0
REPUESTOS P/MAT. DE TRANSPORTE
No
61
187
259
155
207
207
179
154
161
609
REPUESTOS PARA MAQUINARIA
No
7,306
6,341
9,404
9,828
16,516
16,734
10,995
8,331
9,349
11,523
REPUESTOS PARA VEHICULOS
No
5,152
5,942
4,825
7,580
7,399
7,025
3,686
4,731
3,665
10,123
RESINA SINTETICA
No
90,157
96,360
73,295
82,292
92,948
78,994
91,306
70,855
83,970 102,533
SEBO INDUSTRIAL
No
4,782
2,793
11,577
7,040
14,131
32,892
47,287
28,455
16,939
27,033
SEMILLA DE ALGODON
No
21
316
278
256
3
114
72
0
SOYA
No
2,365
2,222
4,529
4,979
6,996
3,145
4,374
839
548
4,488
ST. QUIMICOS INDUSTRIALES BASICAS
Yes
479
3,976
7,364
8,575
5,872
5,610
7,429
3,160
3,034
2,007
TABACO EN BRUTO
No
4
65
89
370
196
412
87
283
122
147
TANQUES VACIOS
No
33
462
465
535
263
1,040
425
352
145
402
TE DE LIMON Y OTROS
No
3
1
4
42
25
137
22
TEXTILES PARA MAQUILA
No
16,780
31,053
41,359
49,708
74,659
88,875
106,717
145,020
146,540 132,966
TEXTILES,PRENDAS VESTIR,CUERO
No
40,069
32,918
35,463
43,357
42,160
37,534
45,714
53,893
64,920 111,744
TRIGO
No
6,444
5,355
687
4,735
3,456
562
11,541
659
183
VEHICULOS AUTOMOTORES
No
12,593
9,283
10,574
8,906
8,357
10,081
9,357
17,103
17,367
18,003
YUTE EN RAMA
No
2,243
39
85
18
342
181
597
1,260
479
610
T O T A L E S
1,400,861 1,520,720 1,541,145 1,459,037 1,651,409 2,129,042 2,087,680 2,077,318 2,100,729 2,285,768
FUENTE DE INFORMACION: SECCION DE ESTADISTICA
Source: Informe Estadistico, Empresa Portuaria Nacional Santo Tomás de Castilla
C12
C. 8. Puerto Santo Tomás de Castilla Export Statistics (Metric Tons), 1993 - 2002
Type
Hazardous 1993
1994
1995
1996
1997
1998
1999
2000
2001
2002
ABONOS
No
227
27
35
95
17
117
ACEITES,GRASA VEGETAL Y ANIMAL
No
573
764
438
626
564
2,308
1,338
1,827
2,286
415
AJONJOLI
No
31,932
25,818
27,643
24,223
22,871
20,301
15,502
15,659
13,254
18,138
ALGODON INCLUYE BORRA
No
564
637
170
69
306
166
96
310
243
140
ARCILLA *
No
2
298
70
35
2,253
181
ARCILLA, CONCRETO Y OTROS
No
0
16
0
0
0
ARENA
No
45
1,584
0
ARROZ
No
18
0
ASBESTOS
Yes
10
0
AUTOBUSES
No
1
9
83
15
10
AVENA
No
2,877
1,181
3,576
5,406
100
AZUCAR Y DERIVADOS
No
102
1,567
1,006
20 355,959 324,777 153,707 239,636
5,497
5,835
BANANOS
No
230,494 275,038 284,051 326,272
15,697
18,949
23,413
14,574 213,915 238,756
BARRO, LOZA, PORCELANA Y VIDRIO
No
10,475
11,797
5,685
15,589
1,016
831
2,014
3,870
17,316
24,291
BEBIDAS ALCOHOLICAS O ARTIF.
No
801
575
568
1,257
57
5
6,012
12,660
BICICLETAS
No
12
41
20
0
CACAO
No
144
103
302
327,606 241,309 317,195 362,173
0
CAFE EN GRANO
No
237,944 204,191 223,905 275,252
5,469
6,411
6,256
4,300 264,504 233,370
CAMARONES, LANGOSTAS
No
8,338
7,610
6,273
10,266
27
101
76
83
7,020
8,811
CAMIONES
No
18
18
9
1,249
1,543
396
89
95
CAŃA DE IZOTE
No
1,578
312
780
1,348
138
422
CAOLIN
No
9
8
30
0
CARBON
No
15,407
12,756
12,083
12,987
0
0
CARDAMOMO
No
12,431
14,211
13,999
15,616
175
36
10
41
13,701
19,830
CARNES
No
8,843
5,936
3,494
314
31
249
130
15
133
97
CEMENTO, CAL, YESO
No
367
556
567
41
374
18
56
90
23
CERAMICA
No
10
193
378
455
553
663
CHASISES PARA CONT. Y FURG.
No
49
3
17
2,195
373
315
402
96
74
CINCHONA QUINA
No
494
517
517
459
1
335
442
CONCRETO Y OTROS
No
259
88
39
56
6,428
5,688
4,918
9,708
55
35
DESPERDICIO DE PAPEL
No
627
10,253
12,853
DIESEL Y OTROS ACEITES COMBUST.
Yes
0
0
0
0
0
C13
Type
Hazardous 1993
1994
1995
1996
1997
1998
1999
2000
2001
2002
ESPECIES
No
305
563
850
1,165
1,101
918
79
99
958
2,056
FIBRAS SINTETICAS, TEXTILES
No
71
294
268
403
347
101
2,139
190
FIBRAS Y RESINAS SINTETICAS
No
186
135
159
288
0
0
FRIJOL EN GRANOS
No
84
136
816
106
7,258
12,409
10,162
11,885
468
19
FRUTAS
No
3,450
4,988
5,994
8,713
378
105
120
104
8,988
9,219
GOMA DE MASCAR
No
1,033
1,310
1,221
356
97
23
196
240
GRANOS BASICOS
No
84
66
11
31
23
0
HARINA
No
20
11
67,043
56,675
61,845
42,143
60
288
HORTALIZAS
No
64,085
71,116
65,053
63,923
6,737
2,615
1,954
2,710
38,427
52,566
HULE NATURAL SIN PROCESO
No
4,644
4,637
7,288
9,270
45
0
3,466
JUEGOS MECANICOS
No
144
21
154
104
120
LECHE
No
133
194
44
18
19
305
101
LANCHAS Y MOTOS ACUATICAS
No
393
442
1,362
1,291
0
0
LIMON SECO
No
369
374
707
370
7,059
5,019
4,915
7,140
10,087
911
MADERA ASERRADA
No
4,205
6,005
8,938
8,315
227
549
22
506
7,524
4,189
MAIZ
No
2
49
49
733
573
MALTA
No
18
1,633
1,784
1,215
1,669
0
13
MAQUINARIA Y EQUIPO
No
2,714
3,086
990
553
5,878
5,186
3,759
3,466
1,072
902
MARMOL
No
1,159
938
2,727
5,713
2
21
50
54
2,143
2,818
MATERIAL DE TRANSPORTE
No
175
31
173
21
60,538
48,416
66,957
85,702
23
55
MELON
No
55,845
61,718
53,821
51,681
1,198
967
1,641
1,591
71,217 113,011
MENAJE DE CASA EFEC. PERSONALES
No
738
869
887
914
2,895
3,801
2,527
2,005
1,720
1,357
MIEL DE ABEJAS
No
3,268
3,501
3,242
3,488
127
19
477
3,112
2,362
MINERALES METALICOS
No
293
138
3
4
0
3
282
0
MOTOCICLETAS
No
1
2,441
1,638
1,743
1,498
10
2
MUEBLES DE MADERA
No
730
1,367
1,922
2,413
1,085
862
817
731
1,614
1,579
NEUMATICOS
No
33
621
453
471
582
170
117
NUEZ
No
481
386
359
477
1,622
952
4,159
3,534
601
508
OTRAS INDUSTRIAS
No
797
839
508
831
155
262
770
171
1,474
1,384
OTRAS SEMILLAS
No
476
193
58
13
9,965
14,095
12,919
17,459
810
204
OTROS ALIMENTOS
No
6,231
7,223
7,916
8,443
226
1,772
10,090
10,019
20,467
36,178
OTROS DESTILADOS DEL PETROLEO
Yes
178
32,635
653
265
795
272
843
55
35,692
4,148
OTROS MINERALES
No
37
149
10
40
115
0
218
0
OTROS PRODUCTOS AGRICOLAS
No
16
16
3,386
5,775
6,219
15,244
0
0
C14
Type
Hazardous 1993
1994
1995
1996
1997
1998
1999
2000
2001
2002
OTROS PRODUCTOS METALICOS
No
2,662
2,006
2,258
2,241
2
0
0
7,429
10,765
OTROS PRODUCTOS PARA MAQUILA
No
12,709
14,240
13,799
20,189
629
88
OTROS PRODUCTOS QUIMICOS
Yes
3,963
6,555
5,836
12,029
139
553
27
150
16,034
27,216
PALETAS VACIA S
No
15
3,224
3,506
3,715
4,120
0
0
PAPEL, PROD. DE PAPEL, IMPRESOS
No
4,966
6,773
5,779
6,878
709
43
184
7,620
4,997
PESCADOS, OSTRAS, ALMEJAS
No
43
987,734 1,271,760 1,155,482 1,057,760
55
140
PETROLEO CRUDO
Yes
346,575 254,967 447,581 730,372
177
291
143
1,030,909 1,298,311
PIEDRA POMEZ
No
21
42
121
5,413
6,762
7,092
6,281
0
0
PLAGUICIDAS
Yes
2,198
3,440
4,224
5,959
170
2,177
1,668
2,953
8,101
6,371
PLATANOS
No
11
4
37
98
240
238
144
190
4,693
10,554
PLAYWOOD
No
93
20
40
20
0
24
POLLO CONGELADO
No
37
624
1,267
662
938
411
172
PROD. DE ASBESTOS Y FIBROCEMENTO
No
23
229
718
2,111
3,527
4,400
5,493
3,173
1,912
PROD.ASBESTO Y FIBROCEMENTO
No
1,220
2,286
2,325
2,766
1,659
0
PROD. DE MADERA EXCEPTO MUEBLE
No
3,237
3,217
2,510
2,468
3,124
3,099
2,054
1,882
0
5,135
PROD. ELECTRICOS Y ELECTRONICOS
No
250
396
337
659
189
59
654
99
2,777
5,782
PROD. FARMACEUTICOS, MEDICAMENTO
No
243
365
805
1,640
52
73
1,284
1,144
PROD. METALICOS ESTRUCTURALES
No
20
52
5
23
19
47
1,865
PROD. Y MATERIAL REFRACTORIO
No
2,583
2,967
2,186
1,532
325
0
PROD. Y EQUIPO DE OFICINA
No
22
501
18
104
720
56
10
PRODUCTOS DE CAUCHO
No
1,881
3,504
4,157
3,425
4
16
1,949
1,391
PRODUCTOS DE MARMOL
No
1
15,889
16,488
18,691
20,150
2,298
0
PRODUCT OS DE PESCA- SIN PROCESO
No
273
5,582
6,190
2,747
3,278
0
PRODUCTOS DE SILVICULTURA
No
12,436
10,510
12,160
15,028
3,195
4,396
3,673
3,607
19,893
19,142
PRODUCTOS DE TABACO
No
183
402
14
4,807
5,560
4,939
6,133
4,176
9,661
PRODUCTOS METALICOS BASICOS
No
26
478
3,524
313
657
1,814
3,626
PRODUCTOS PLASTICOS
No
3,391
4,255
3,661
4,777
6
6,585
9,413
PULPA DE MADERA
No
2
59
19
23
0
0
RASTRA VACIA
No
271
664
685
998
0
0
REPUESTO P/MAT. DE TRANSPORTE
No
26
0
56
6
67
266
265
183
95
26
REPUESTOS PARA MAQUINARIA
No
159
234
292
236
234
541
325
690
2,322
453
REPUESTOS PARA VEHICULOS
No
2,608
4,269
6,073
3,024
141
411
RESINA SINTETICA
No
168
269
435
366
44
23
15
713
1,970
SANDIA
No
930
4,128
4,867
C15
Type
Hazardous 1993
1994
1995
1996
1997
1998
1999
2000
2001
2002
SEMILLA DE ALGODON
No
142
575
187
564
23
3
SOYA
No
22
7,997
2,507
1,903
5,039
279
0
ST. QUIMICOS INDUSTRIALES BASICOS
Yes
19
83
27
46
60
97
324
802
TABACO EN BRUTO
No
13,880
7,864
3,247
6,702
232
131
100
46
1,915
1,704
TANQUES VACIOS
No
12
138
36
159
52
48
140
1,267
1,330
TE DE LIMON Y OTROS
No
261
172
109
121 125,708 150,055 190,781 240,783
277
25
TEXTILES PARA MAQUILA
No
947
493
845
1,200
161
301
186
182
37
TEXTILES,PRENDAS VESTIR,CUERO
No
34,841
60,299
64,072
86,684
62
237,544 268,659
TRIGO
No
0
0
0
0
4
VEHICULOS AUTOMOTORES
No
247
234
665
168
344
227
YUTE EN RAMA
No
16
19
19
T O T A L E S
1,129,234 1,118,465 1,294,803 1,726,912 2,123,948 2,307,959 2,166,492 2,271,365 2,144,384 2,514,193
FUENTE DE INFORMACION: SECCION DE ESTADISTICA
Source: Informe Estadistico, Empresa Portuaria Nacional Santo Tomás de Castilla
C16
C. 9. Puerto Barrios Import/Export Statistics (metric tons), 2002
Imports
Type
Hazardous
2,002
Granel Liquido
Unknown
Yes
171,646
Granel Solido
Fertilizante a granel
No
45,806
Fertilizante en sacos
No
4,674
Mercado General
Hierro
No
150,907
Vehiculos
No
1,334
Madera
No
14,005
Azúcar
No
7,847
Otros
No
8,423
Total Imports
404,643
Exports
Type
Hazardous
2,002
Contenedor
Banano
No
602,567
Otro
No
256,137
Mercado General
Banano Granel
No
12,325
Banano Palet.
No
0
Melon
No
65,963
Fertilizantes Sacos
No
7,823
Otros
No
3,656
Total Exports
948,469.83
Source: Puerto Barrios
C17
C. 10. Puerto Cortés Import/Export Statistics Summary (metric tons), 1992 - 2001
Imports
Cargo
Sub-type
1992
1993
1994
1995
1996
1997
1998
1999
2000
2001
Hazardous
645,526
717,058
809,735
1,064,189
960,982
989,809
1,161,342
1,134,186
1,069,565
1,140,447
Petroleum
596,147
667,143
736,580
1,011,517
840,480
920,301
1,077,016
1,055,502
995,912
1,065,834
Non-Petroleum
49,379
49,915
73,155
52,672
120,502
69,508
84,326
78,684
73,653
74,613
Non-Hazardous
625,182
910,977
971,964
956,372
1,013,190
1,307,168
1,407,947
1,573,894
1,587,735
2,059,346
Banana
0
1
2
3
4
5
6
7
8
9
Non-Banana
625,182
910,976
971,962
956,369
1,013,186
1,307,163
1,407,941
1,573,887
1,587,727
2,059,337
Total
1,270,708
1,628,035
1,781,699
2,020,561
1,974,172
2,296,977
2,569,289
2,708,080
2,657,300
3,199,793
Exports
Cargo
Sub-type
1992
1993
1994
1995
1996
1997
1998
1999
2000
2001
Hazardous
0
0
482
2,320
0
0
758
0
0
0
Petroleum
0
0
482
2,320
0
0
758
0
0
0
Non-Petroleum
0
0
0
0
0
0
0
0
0
0
Non-Hazardous
1,279,193
1,316,242
1,207,380
1,382,450
1,505,190
1,684,893
1,751,410
1,485,025
1,933,288
1,963,348
Banana
541,640
538,586
309,837
429,936
508,611
446,515
382,760
109,707
289,484
355,864
Non-Banana
737,553
777,656
897,543
952,514
996,579
1,238,378
1,368,650
1,375,318
1,643,804
1,607,484
Total
1,279,193
1,316,242
1,207,862
1,384,770
1,505,190
1,684,893
1,752,168
1,485,025
1,933,288
1,963,348
Import and Exports
Cargo
Sub-type
1992
1993
1994
1995
1996
1997
1998
1999
2000
2001
% growth
Hazardous
645,526
717,058
810,217
1,066,509
960,982
989,809
1,162,100
1,134,186
1,069,565
1,140,447
5.9%
Petroleum
596,147
667,143
737,062
1,013,837
840,480
920,301
1,077,774
1,055,502
995,912
1,065,834
6.0%
Non-Petroleum
49,379
49,915
73,155
52,672
120,502
69,508
84,326
78,684
73,653
74,613
4.2%
Non-Hazardous
1,904,375
2,227,219
2,179,344
2,338,822
2,518,380
2,992,061
3,159,357
3,058,919
3,521,023
4,022,694
7.8%
Banana
541,640
538,587
309,839
429,939
508,615
446,520
382,766
109,714
289,492
355,873
-4.1%
Non-Banana
1,362,735
1,688,632
1,869,505
1,908,883
2,009,765
2,545,541
2,776,591
2,949,205
3,231,531
3,666,821
10.4%
Total
2,549,901
2,944,277
2,989,561
3,405,331
3,479,362
3,981,870
4,321,457
4,193,105
4,590,588
5,163,141
7.3%
Source: Empresa Nacional Portuaria
C18
C. 11. Puerto Cortés Import/Export Statistics (metric tons), 1992 - 2001
IMPORTACION
Hazardous
1992
1993
1994
1995
1996
1997
1998
1999
2000
2001
TRIGO
No
106,542
228,168
233,374
136,908
120,013
165,394
152,722
214,473
168,280
199,379
OTROS PRODUCTOS ALIMETICOS
No
103,028
101,950
151,128
211,324
182,962
286,276
272,592
267,329
414,634
544,049
BEBIDAS Y TABACO
No
1,862
2,349
2,044
1,670
2,554
4,165
1,909
4,092
2,374
7,462
PRODUCT OS QUIMICOS
Yes
49,379
49,915
73,155
52,672
120,502
69,508
84,326
78,684
73,653
74,613
CARBON MINERAL
No
111,968
123,172
GRASA DE ORIGEN ANIM/VEG.
No
9,238
5,416
3,804
19,279
14,031
10,724
22,017
29,626
21,039
14,459
FERTILIZANTES
No
88,833
173,418
177,989
152,323
212,690
238,361
239,158
243,097
212,128
196,417
DERIVADOS DE PETROLEO
Yes
596,147
667,143
736,580 1,011,517
840,480
920,301 1,077,016 1,055,502
995,912 1,065,834
HIERRO Y ACERO
No
53,248
74,668
61,677
50,277
44,303
48,365
85,106
75,172
62,066
88,720
MAQUINARIA Y EQUIPO/TRANS.
No
21,776
29,323
25,529
23,954
22,171
36,988
53,186
45,765
46,223
40,211
PAPEL Y CARTON EN BOBINAS
No
17,042
19,657
18,357
28,356
32,444
34,822
41,692
53,487
40,735
45,574
OTROS
No
223,613
276,027
298,060
332,278
382,018
482,068
539,559
640,846
508,280
799,894
TRANSITO
NACIONAL
204,181
263,095
308,346
363,834
396,968
489,435
536,421
549,912
576,192
280,487
EXTRANJERO
55,231
79,172
130,825
116,179
116,388
206,360
233,215
234,073
231,464
218,322
TOTAL IMPORTACION
1,530,120 1,970,301 2,220,868 2,500,571 2,487,524 2,992,767 3,338,919 3,492,058 3,464,948 3,698,593
EXPORTACION
CARNE
No
17,147
16,729
16,206
6,646
5,096
4,735
702
616
430
489
PLANTANOS
No
13,370
8,516
2,526
2,108
667
1,055
1,194
3,777
392
751
BANANOS
No
529,378
527,293
303,532
415,244
491,528
428,291
366,574
101,841
284,805
350,916
PURE DE BANANOS
No
12,262
11,293
6,305
14,692
17,083
18,224
16,186
7,866
4,679
4,948
CAFÉ
No
106,822
91,223
91,991
102,749
116,254
98,509
134,302
112,796
156,947
131,085
AZUCAR
No
12,820
11,504
11,461
13,292
19,363
24,275
18,121
10,399
6,669
88,208
TABACO
No
4,009
5,563
3,402
2,735
3,830
4,721
4,810
4,557
5,342
4,964
MADERA
No
81,472
103,771
87,961
74,579
74,073
90,660
77,115
103,645
88,966
95,172
CEMENTO
No
29,167
574
5,831
12,495
MAIZ
No
MINERALES
No
72,325
52,460
52,802
66,488
64,954
106,636
91,902
82,801
92,817
57,337
COMBUST. Y DERIV/PETROL.
Yes
482
2,320
758
MELAZA
No
23,546
17,209
21,201
11,901
10,350
31,098
26,182
37,339
65,559
46,035
ACEITE DE PALMA AFRICANA
No
2,038
6,048
2,585
1,000
3,064
15,716
11,173
11,571
PINAS
No
7,863
2,937
3,687
6,422
6,552
7,185
15,896
26,406
14,275
7,958
COCOS
No
492
7
133
225
210
367
396
99
3
C19
IMPORTACION
Hazardous
1992
1993
1994
1995
1996
1997
1998
1999
2000
2001
TORONJAS
No
1,121
1,610
55
749
1,576
2,161
109
7,619
1,391
10,470
MELONES
No
57,691
68,958
75,272
77,265
69,079
105,536
98,088
101,632
99,443
109,080
OTRA FRUTAS
No
4,816
7,260
6,722
11,786
13,674
6,701
9,783
10,957
13,031
8,441
OTROS
No
278,167
322,612
390,298
435,455
480,008
580,469
683,724
708,135
810,617
805,944
MERCADEIRA DE OTROS PAISES
No
24,687
67,297
127,911
137,621
129,878
171,363
190,639
152,496
270,424
229,052
TOTAL EXPORTACION
1,279,193 1,316,242 1,207,862 1,384,770 1,505,190 1,684,893 1,752,168 1,485,025 1,933,288 1,963,348
TOTAL EXPORTACION+IMPORTACION
2,809,313 3,286,543 3,428,730 3,885,341 3,992,714 4,677,660 5,091,087 4,977,083 5,398,236 5,661,941
Source: Empresa Nacional Portuaria
C20
C. 12. Puerto Cortés Ship Calls, 1992 - 2001
TIPO DE FUNCION
1992
1993
1994
1995
1996
1997
1998
1999
2000
2001
CARGUERO CONVENCIONAL
119
106
135
128
113
110
199
228
166
197
CONVENCIONAL REFRIGERADO
148
114
69
58
82
97
71
84
54
88
MADERERO
19
26
19
13
12
49
27
66
34
35
GRANELERO SOLIDO
43
63
60
70
65
85
73
84
90
98
GRANELERO LIQUIDO
84
97
100
121
114
131
143
199
140
118
PORTACONTENDEOR
499
565
603
721
615
660
731
789
838
750
PORTAFURGONES
275
315
252
292
306
366
398
454
447
440
LASTRE
28
25
12
7
9
17
22
34
12
46
PASAJE
9
31
41
42
9
43
30
13
9
14
Total
1,224
1,342
1,291
1,452
1,325
1,558
1,694
1,951
1,790
1,786
Source: Empresa Nacional Portuaria
C21
C. 13. Port-Related Enterprises located in the ZOLIC at Puerto Santo Tomás de Castillo
PERENCO
This company exports Guatemala's crude oil (at the end of the year 2002, PERENCO purchased Basic Resources, which is responsible for crude oil exploration).
The port's terminal has 5 tanks (4 with a capacity of 55,000 barrels, and 1 with 35,000 barrel capacity) and an underground network/conduction area of 12" x 8".
There are approximately 350 km. from the crude's intake to the storage exporting tanks located in the port. This oil pipeline crosses the Río Dulce via underground
and has an average loading movement of 5,300 barrels/hour.
REFINERIA GUATEMALTECA
This company imports oil and other refined products, such as diesel, gasoline and kerosene. The facilities of Refinería Guatemalteca include:
·
2 tanks of 100,000 gallons each for the reception of diesel
·
1 tank of 100,000 gallons for the reception of super gasoline
·
2 tanks of 26,000 gallons each for the reception of regular gasoline
·
2 tanks of 10,000 gallons each for the reception of kerosene
·
2 tanks of 20,000 gallons each for the reception of any type of product in case of an emergency situation
·
1 tank of 30,000 gallons for the reception of any type of product in case of an emergency situation
·
An oil pipeline of 14" with an average unloading movement of 4,000 barrels/hour
SHELL GUATEMALA S, A. - ASPHALTS AND LUBRICANTS
·
2 asphalt tanks each with a capacity of 14,852 barrels
·
1 asphalt tank with a capacity of 7,714 barrels
·
1 asphalt tank with a capacity of 714 barrels
·
1 lubricant tank with a capacity of 7,750 barrels
·
1 lubricant tank with a capacity of 3,172 barrels
·
1 lubricant tank with a capacity of 1,392 barrels
·
An oil pipeline of 8" for asphalt with a loading movement of 1,200 barrels/hour
·
An oil pipeline of 6" for lubricants with a loading movement of 800 barrels/hour
GAS DEL PACIFICO, S. A. PROPANE GAS
·
14 tanks each with a capacity of 66,045 gallo ns
·
27 tanks each with a capacity of 30,000 gallons
C22
·
An oil pipeline of 6" with an average discharge of 85 tons/hour
·
INCOSIDA/AGISA: Handles animal feeds
·
1 tank with a capacity of 131,739 gallons
·
1 tank with a capacity of 152,961 gallons
·
An oil pipeline of 4" with an average discharge of 60 tons/hour
MOJA LA LUZ : Handles vegetable oils and feeds
·
1 tank with a capacity of 82,000 gallons
·
2 tanks with a capacity of 43,000 gallons each
·
1 tank with a capacity of 65,000 gallons
·
1 tank with a capacity of 104,000 gallons
·
1 tank with a capacity of 209,000 gallons
·
2 tanks with a capacity of 158,000 gallons each
·
2 oil pipelines of 4" (one of them is not operational) with an average discharge of 65 tons/hour
OLMECA VALDES GRASAS: Handles vegetable oils and feeds
·
3 tanks with a capacity of 64,000 gallons each
·
3 tanks with a capacity of 137,000 gallons each
·
1 tank with a capacity of 25,000 gallons
·
1 tank with a capacity of 143,000 gallons
·
1 tank with a capacity of 295,000 gallons
·
1 tank with a capacity of 211,000 gallons
·
2 conducting lines of 4" with an average discharge of 65 tons/hour per line
ENTERPRISES INSTALLED IN THE FREE ZONE
As mentioned above, 39 enterprises are currently operating in ZOLIC. The following companies are the most significant, considering their size and potential
environmental risks due to the types of product:
C23
CENTRO QUÍMICO Distributes twelve different types of products
·
6 tanks with a capacity of 16,000 gallons each
·
12 tanks with a capacity of 34,000 gallons each
·
5 tanks with a capacity of 26,000 gallons each
·
2 tanks with a capacity of 40,500 gallons each
·
1 tank with a capacity of 31,500 gallons
·
2 tanks with a capacity of 78,108 gallons each
·
1 tank with a capacity of 138,700 gallons
·
1 tank with a capacity of 126,500 gallons
·
1 tank with a capacity of 125,000 gallons
·
1 tank with a capacity of 260,000 gallons
·
An oil pipeline of 6" with a loading movement of 95 tons/hour
·
3 oil pipelines of 4" with a loading movement of 60 tons/hour
ELECTRO QUÍMICAS DE GUATEMALA Caustic soda
·
1 tank with a capacity of 232,500 gallons
·
1 tank with a capacity of 235,000 gallons
·
An oil pipeline of 6" with a loading movement of 95 tons/hour
·
An oil pipeline of 4" not in use
PROQUISA Oils and feeds
·
5 tanks with a capacity of 80,500 gallons each
·
2 tanks with a capacity of 90,000 gallons each
·
1 tank with a capacity of 66,000 gallons
·
1 tank with a capacity of 59,000 gallons
·
1 tank with a capacity of 81,000 gallons
·
1 tank with a capacity of 130,000 gallons
·
1 tank with a capacity of 94,000 gallons
C24
·
2 tanks with a capacity of 298,000 gallons each
·
An oil pipeline of 6", with an average discharge of 110 tons/hour
ISTANSA - Chemicals
·
1 tank with a capacity of 52,300 gallons
·
2 tanks with a capacity of 52,800 gallons each
·
1 tank with a capacity of 53,000 gallons
·
1 tank with a capacity of 160,000 gallons
·
1 tank with a capacity of 135,500 gallons
·
An oil pipeline of 4" with an average discharge of 50 tons/hour
·
ESSO STANDARD OIL Orchex and lubricants
·
1 tank with a capacity of 427,000 gallons
·
1 tank with a capacity of 628,000 gallons
·
2 tanks with a capacity of 152,000 gallons each
·
2 oil pipelines of 8" with an average discharge of 100 tons/hour
TANQUESA Vegetable oils
·
7 tanks with a capacity of 3,000 gallons each
·
3 tanks with a capacity of 153,000 gallons each
·
An oil pipeline of 4" with an average discharge of 60 tons/hour
TRANSMERIDIAN Chemicals
·
1 tank with a capacity of 90,000 gallons
·
4 tanks with a capacity of 48,000 gallons each
·
3 tanks with a capacity of 47,000 gallons each
·
3 tanks with a capacity of 20,000 gallons each
·
1 tank with a capacity of 103,000 gallons
·
1 tank with a capacity of 102,000 gallons
C25
·
2 oil pipelines of 4" with an average discharge of 60 tons/hour
SHELL GUATEMALA, S.A. Chemicals
·
3 tanks with a capacity of 136,000 gallons each
·
An oil pipeline of 6" with an average discharge of 100 tons/hour
C26